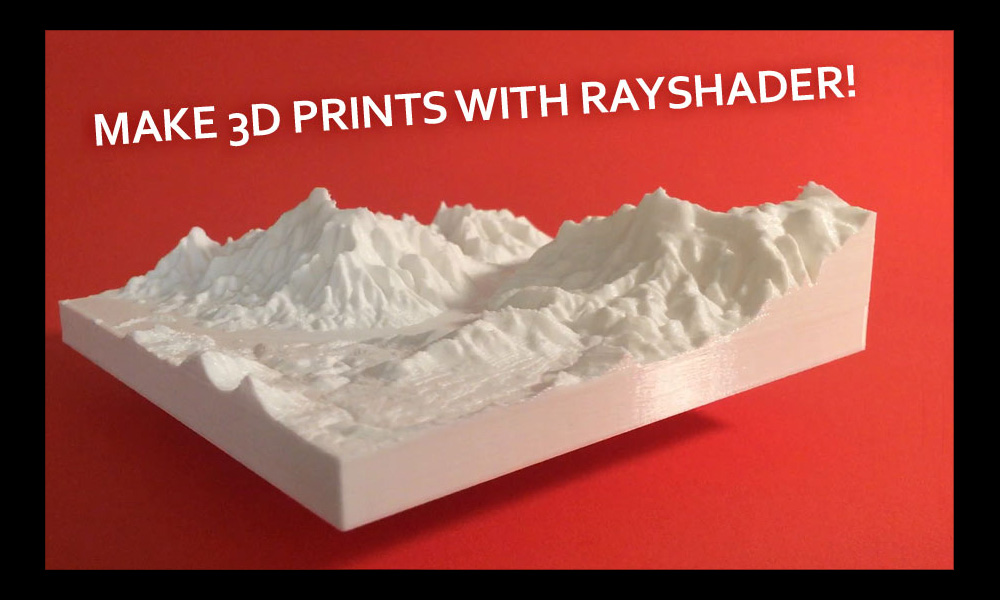
From R to Reality: 3D Printing Maps with Rayshader
I sometimes fall into the trap of thinking writing and the hobbies I write about as a one-way street: I do something interesting, and then I write about it. Rarely do I consider the other way around: I write something that inspires me in real life. This is partly structural: rarely do I write when I don’t have a subject to write about (much to the chagrin of the search engine optimization bots I find lurking in my site’s spam folder, hawking “algorithmic content generation services”… yeesh, no thanks). It’s also partly driven by my personal preferences: for me, programming is a series of fun logic puzzles, each of which when solved results in a little endorphin rush and feeling of pride and accomplishment. Writing, on the other hand, offers me all the fun of typing and retyping the same sentence over and over again (The early 90’s edutainment game Mario Teaches Typing is a fairly accurate representation of my writing process) until I’m “happy” with it, and then moving on to the next sentence to repeat the process. But writing has its benefits–in this case, all that introspection ended up inspiring me to develop a new feature now available in the latest version of rayshader.
In my last post I introduced the new 3D plotting features of rayshader: building beautiful 3D raytraced maps directly from an elevation matrix. It was more than just making the maps 3D, however–I wanted to make them look like a solid object. To accomplish this, I added in a base and a shadow:
When I described them in the blog post, I wrote the following:
I didn’t want the map to look like a carefully crinkled sheet of paper; I wanted a 3D representation that looked like a paper weight, one that you could imagine setting on your work desk and occasionally picking up and examining when you needed a mid-day moment of introspection (i.e. when you are fidgeting).
Writing that got me thinking: how cool would it be actually have one of these maps for real? I wrote that bit about introspection and realized–actually, yes please, I would indeed like a fidget map, thank you (me) very much. The first question was now: how the hell do I do that? Also, how do I convert my 3D on-screen maps to a 3D printable format? Also–how do 3D printers work, and what exactly is that 3D printable format I need?

A few google searches later, and I had a rough draft of my answers: The 3D printable format I was looking for was a stereolithography (STL) file, which thankfully had an export function already in the rgl package. However, I quickly found that the output of this function applied to rayshader was not in a “production 3D printer-ready” format: The default orientation was 90 degrees off , and the size was determined by the size of the underlying matrix–an 800x800 matrix would be bigger and more expensive to print than a 400x400 matrix–and wasn’t able to be specified by the user via that function. And if the user turned on the water layer, shadow layer, or any other aesthetic option in plot_3d it would include those in the print as well.
I originally fixed the issues with the free “meshlab” software, but it wasn’t exactly a solution that I would wish upon end users. It’s the main problem I’ve found when seeing other people explain how to 3D print topographic maps online: the toolchain they describe usually involved software that was way overkill for the intended usage: “Step 1) Download, install, and learn to use QGIS/Blender. Step 2) Now… wait, where did you go?” So, I wrote my own function and included it in rayshader, save_3dprint() (here montereybay and volcano are just N*M matrices of elevation values):
library(rayshader)
#Printing the included `montereybay` dataset:
montereybay %>%
  sphere_shade() %>%
  plot_3d(montereybay,zscale=50)
save_3dprint("montereybay_3d.stl", maxwidth = 150, unit = "mm")
## Dimensions of model are: 150.0 mm x 150.0 mm x 38.2 mm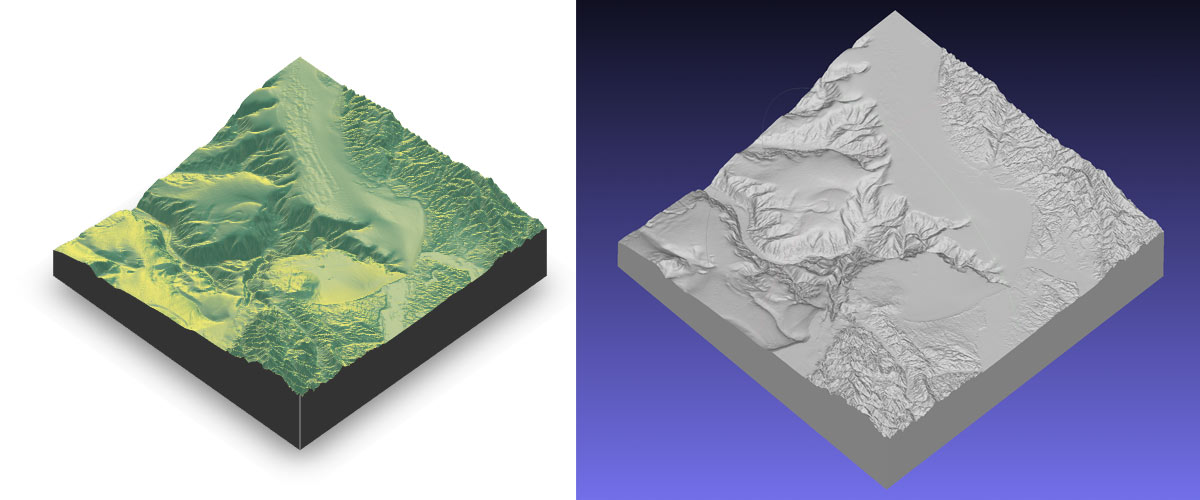
#Printing `volcano`:
volcano %>%
  sphere_shade() %>%
  plot_3d(volcano,zscale=3)
save_3dprint("volcano_3d.stl", maxwidth = 4, unit = "in")
## Dimensions of model are: 4.00 inches x 2.79 inches x 1.88 inche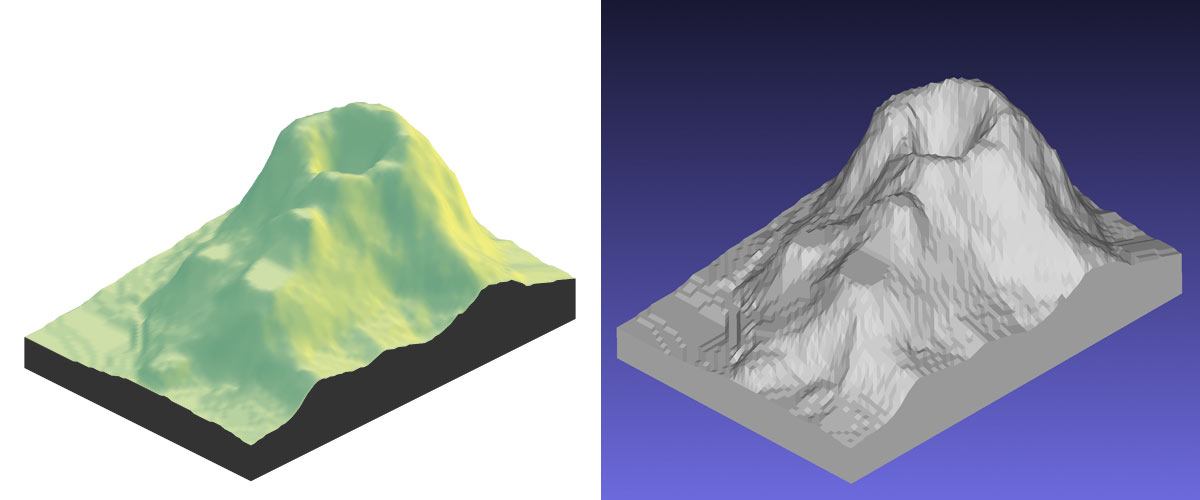
save_3dprint() takes the on-screen 3D matrix, strips off all the aesthetic options (water, lines, shadow), turns it into an STL file, applies transformations to the polygons to correct the orientation and scale the matrix to the size the user wants, and then writes out the print-ready STL file. Notice that it only takes four lines of code to go from source data to finalized 3D printable file–dead simple. It also displays the dimensions of the print when you’re done, so you can sanity check the size of the model before finalizing it. Then it’s ready to be sent off to the printers.
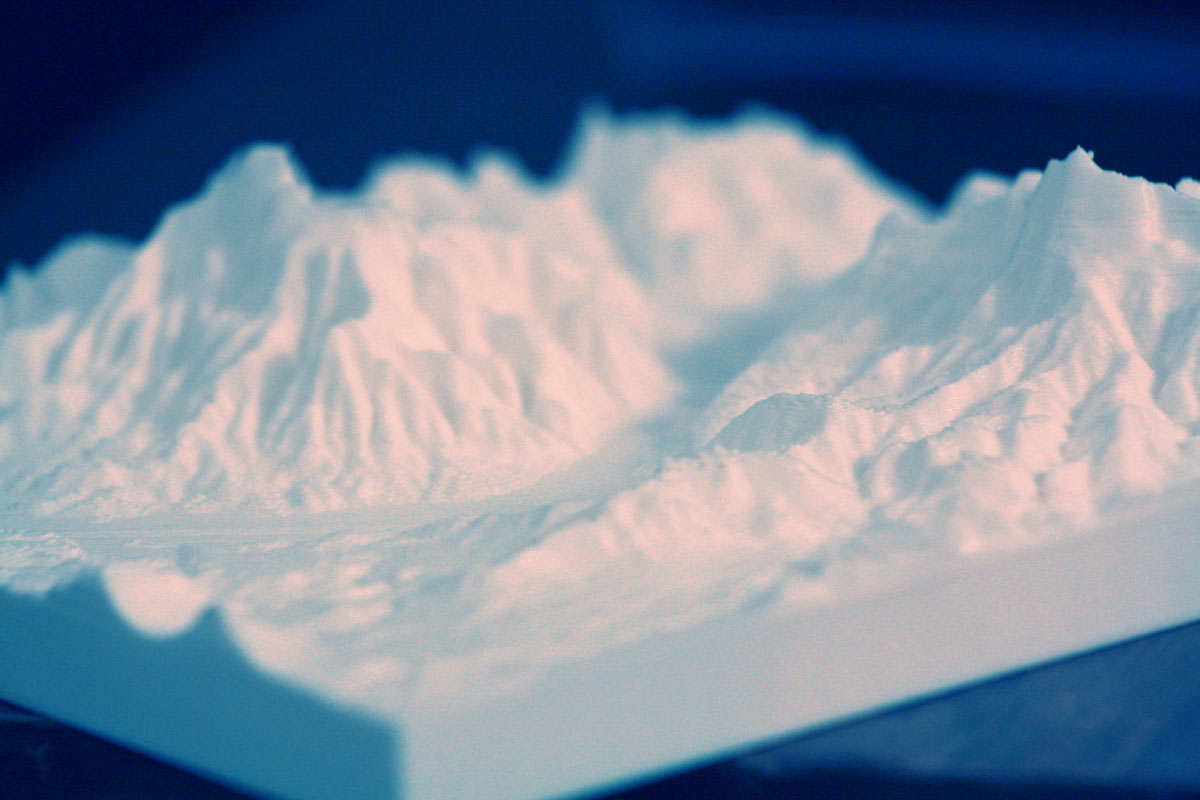
A quick trip to an online 3D printing service, $25, and two weeks later: I now have a nice little representation of Hobart, Tasmania sitting on my desk. I’m excited about the other possibilities easy 3D printing brings to the table: combined with the upcoming 3D ggplot2 feature, you can also print out 3D plots to represent your data. Other than the obvious novelty of having a 3D ggplot, think of the accessibility potential this adds to R: you can now create visualizations (tactilizations? feelizations?) accessible to the visually impaired/blind. You can 3D print a version of your plots if you know someone who might need it will be interested in your talk/data.
diamond dataset in R, visualized in a hexbin plot, transforming between a regular 3D ggplot and a braille 3D ggplot.
And gift ideas abound: if someone you love has a favorite dataset or map, you can easily print it out and bring that enjoyment out of the computer screen and into their life. Create customized gifts for the GIS-inclined. Add buildings to your elevation matrix and 3D print a cityscape. Give some flavor to your D&D game by generating, printing, and painting a custom world map. Or just buy a rotating stand and watch Hobart, Tasmania spin around in circles, a normal person activity that normal people definitely do.
And most impressively: It’s the first thing I’ve ever created in R that has caught the interest of our cat. Catographer approved.
forcats.
And if you want to see more cool stuff, follow me on Twitter and sign up for my newsletter for the latest updates on rayshader! For any easy source of topographic data, check out this website.
You can download the latest version with 3D printing support from GitHub: rayshader on github