Scales, bulks, cuts: Do they work? The answer might surprise you*
*If your bar for surprise is so low that you’re shocked by clickbait on a regular basis
TL;DR: Individual bioimpedance measurements of body fat percentage can vary around ~2% based on hydration levels (based on a Withings Smart Body Analyzer scale). The distribution of water in your body (the time it takes for everything to come into equilibrium after laying down for a long time) also results in a potential shift of approximately 1.5%. Individual measurements based on bioimpedance are not particularly accurate, but on average the reading is correct and long-term trends can be distinguished. A bulk/cut cycle can be an effective strategy for changing the composition of your body, if you proportion the cutting and bulking periods correctly. A high quality scale that measures body fat as well as weight can be an invaluable tool for tracking what works for both weight loss as well as muscle gain, and allows you to adapt and change your routine as you find out what works and what doesn’t.
In health and fitness, talking about weight is often regarded as the main (pardon the expression) elephant in the room. Almost one third of Americans are now considered either obese or morbidly obese, a number that only seems to be getting higher. One of the most helpful decisions someone can do for their health and general well-being is to decide to lose some of the excess baggage they carry around on a daily basis. People at a healthy weight live longer lives1, spend less on medical costs each year2, and (unfairly) are seen as less competent at their jobs3.
One of the best things that someone can do for their waistline is simply know how much they weigh.
No matter how someone decides they are going to lose weight, one of the best things that someone can do for their waistline is simply know how much they weigh4 . This is a tough activity for many people, as when you’re struggling with weight the scale can seem less like a helpful tool and more like judge at an unfair trial, laying down adverse rulings without regards to your applied effort or perseverance. I’m lucky in that I’m fairly pragmatic when it comes to the number on the scale, and thus feel no hard feelings towards myself when I have a bad day or week. But for many people, scales are a demotivating force: a reminder of past failures rather than of current successes. So what then makes a scale such an essential tool?
One reason: it allows you to understand your body and your personal “weight rhythm.” The following graph is a snippet of my weight over a period of a month where I was holding steady: in the green is the actual data measuring my weight twice a day, and in the red is measuring about once every week.
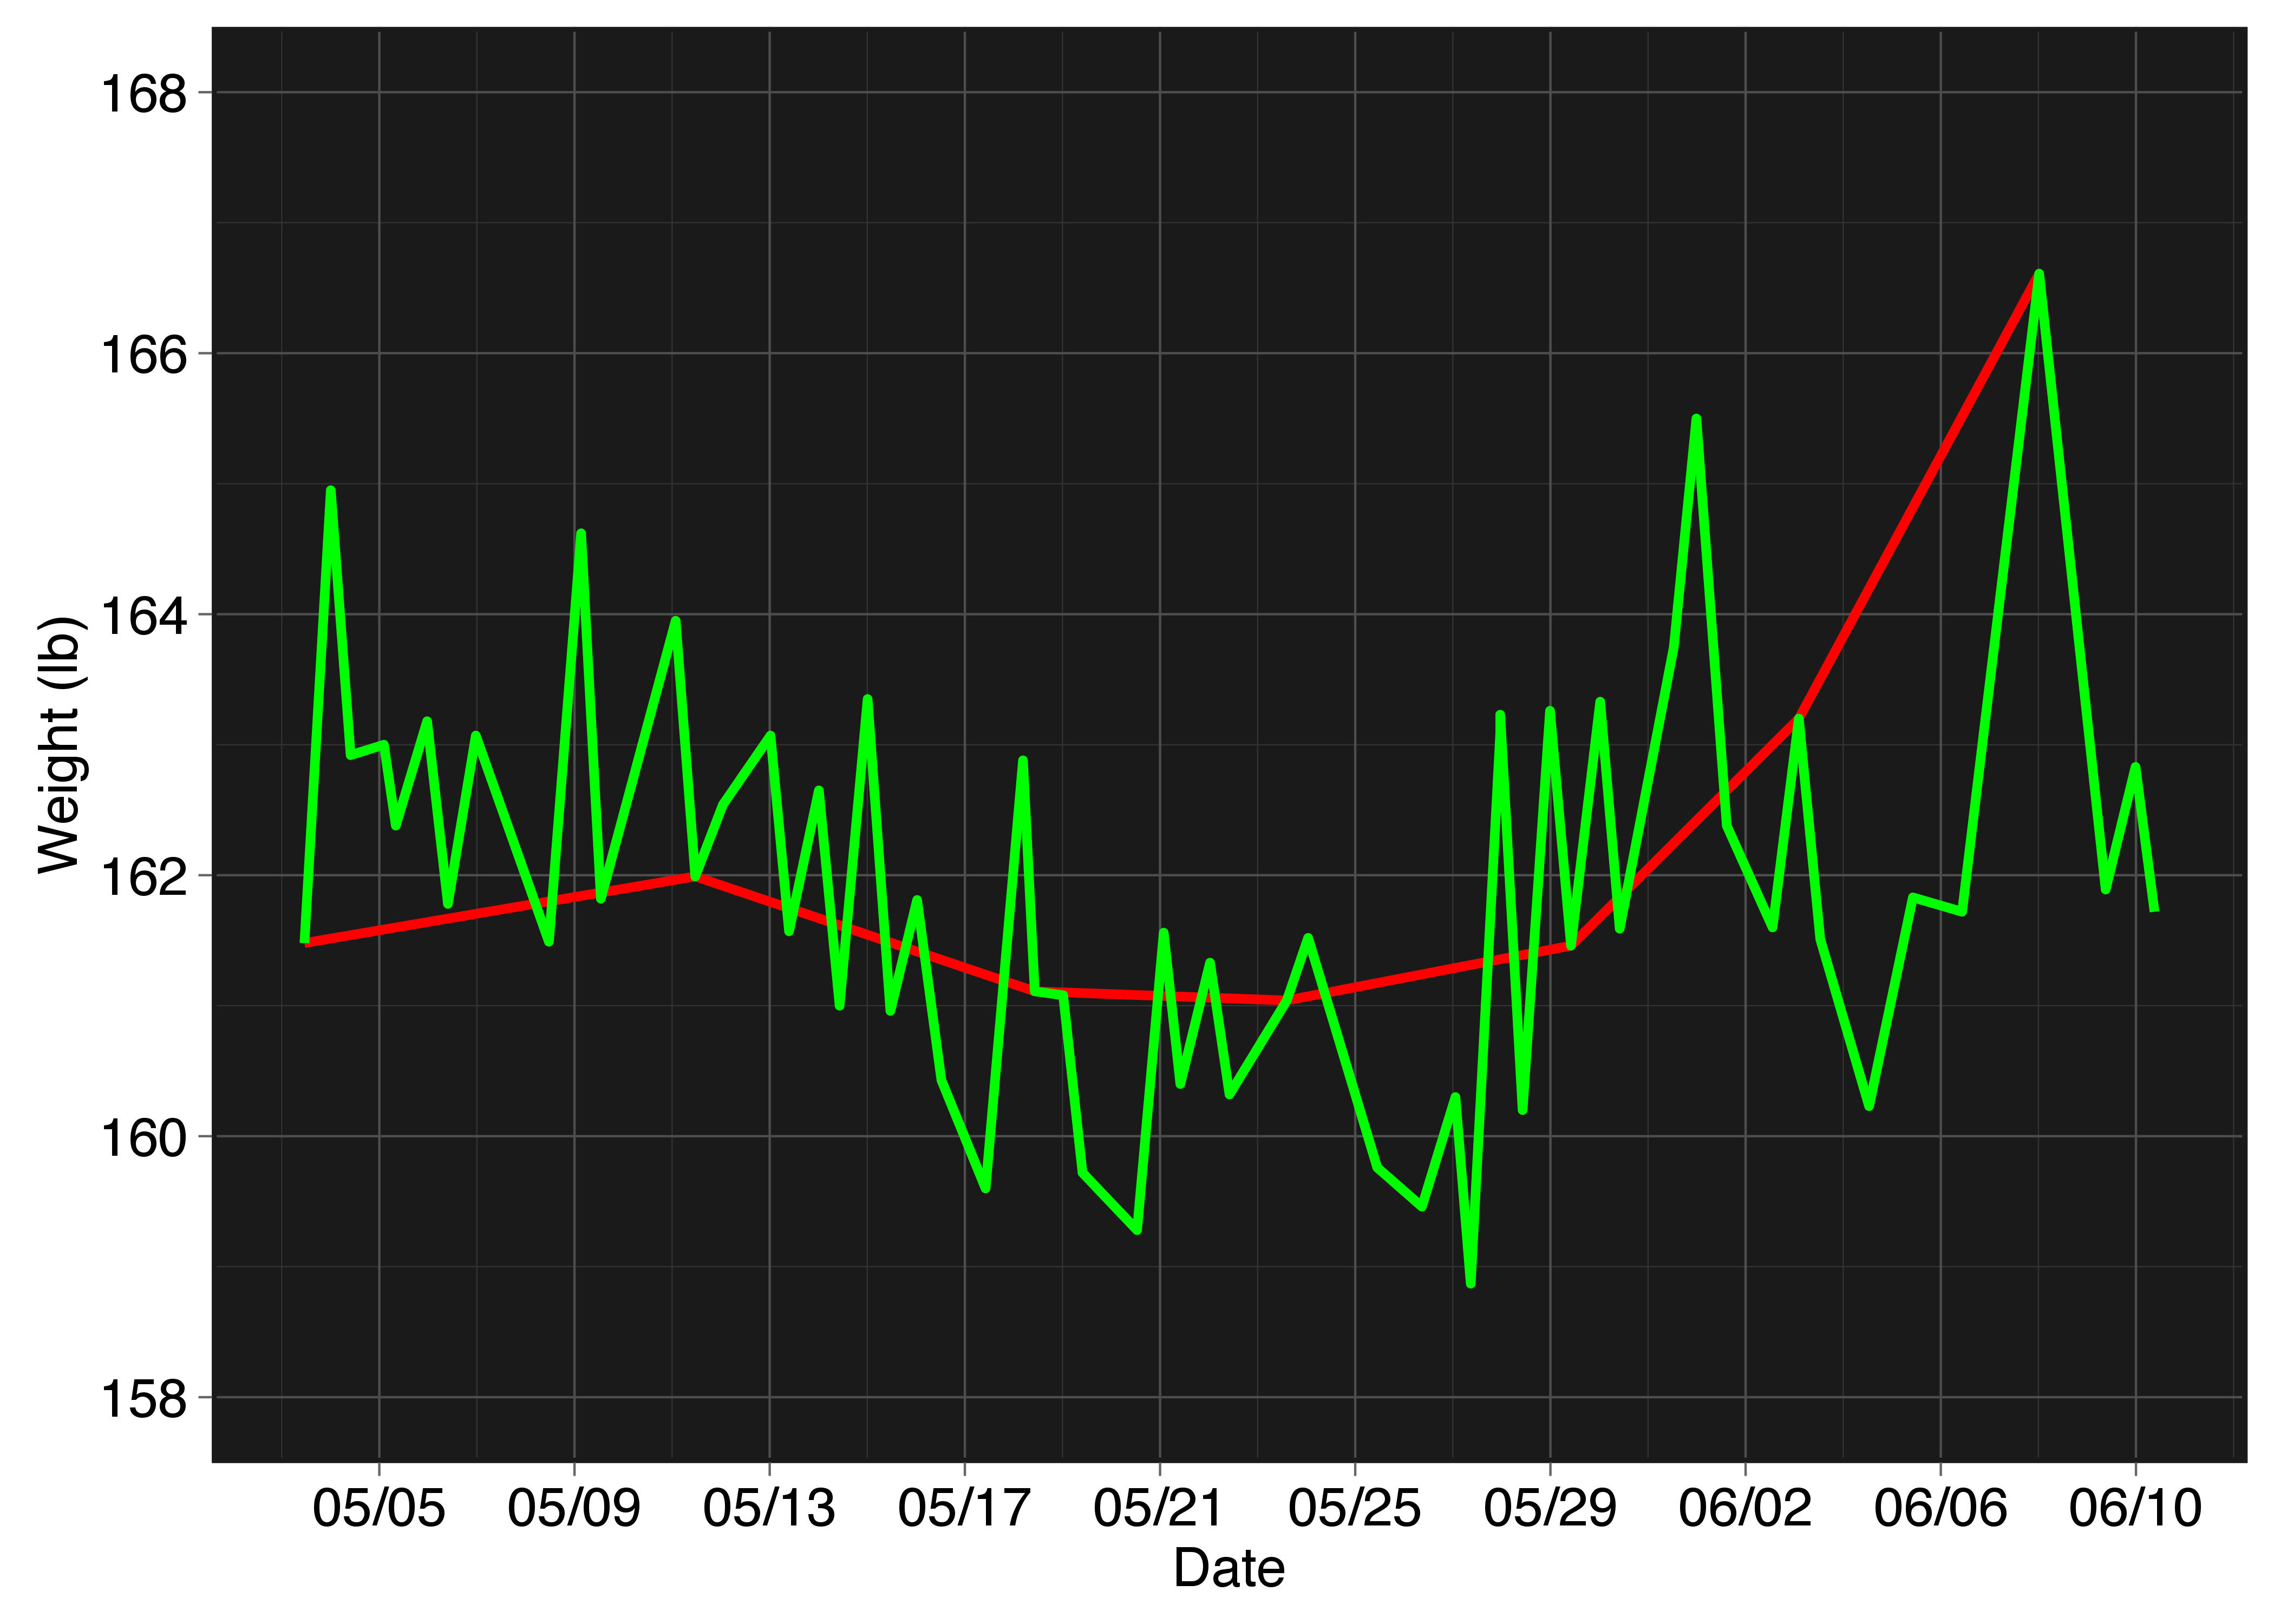
On a day-to-day basis, I see fluctuations of up to 3 lbs in any direction, depending on the time of day. The red line is a sampling of about one measurement per week, which while an obvious outlier in the green looks to be a disappointing upward trend in the coarsely sampled red data. By exposing yourself to your weight on a daily basis, you desensitize yourself to the daily ebb and flow of the number on the plate and begin the path of truly understanding your own body.
In a world of vague promises of 6-minute abs and 60-day full body results (guaranteed!), a scale a remarkably simple tool that allows you to cut through the madness and see what actually works.
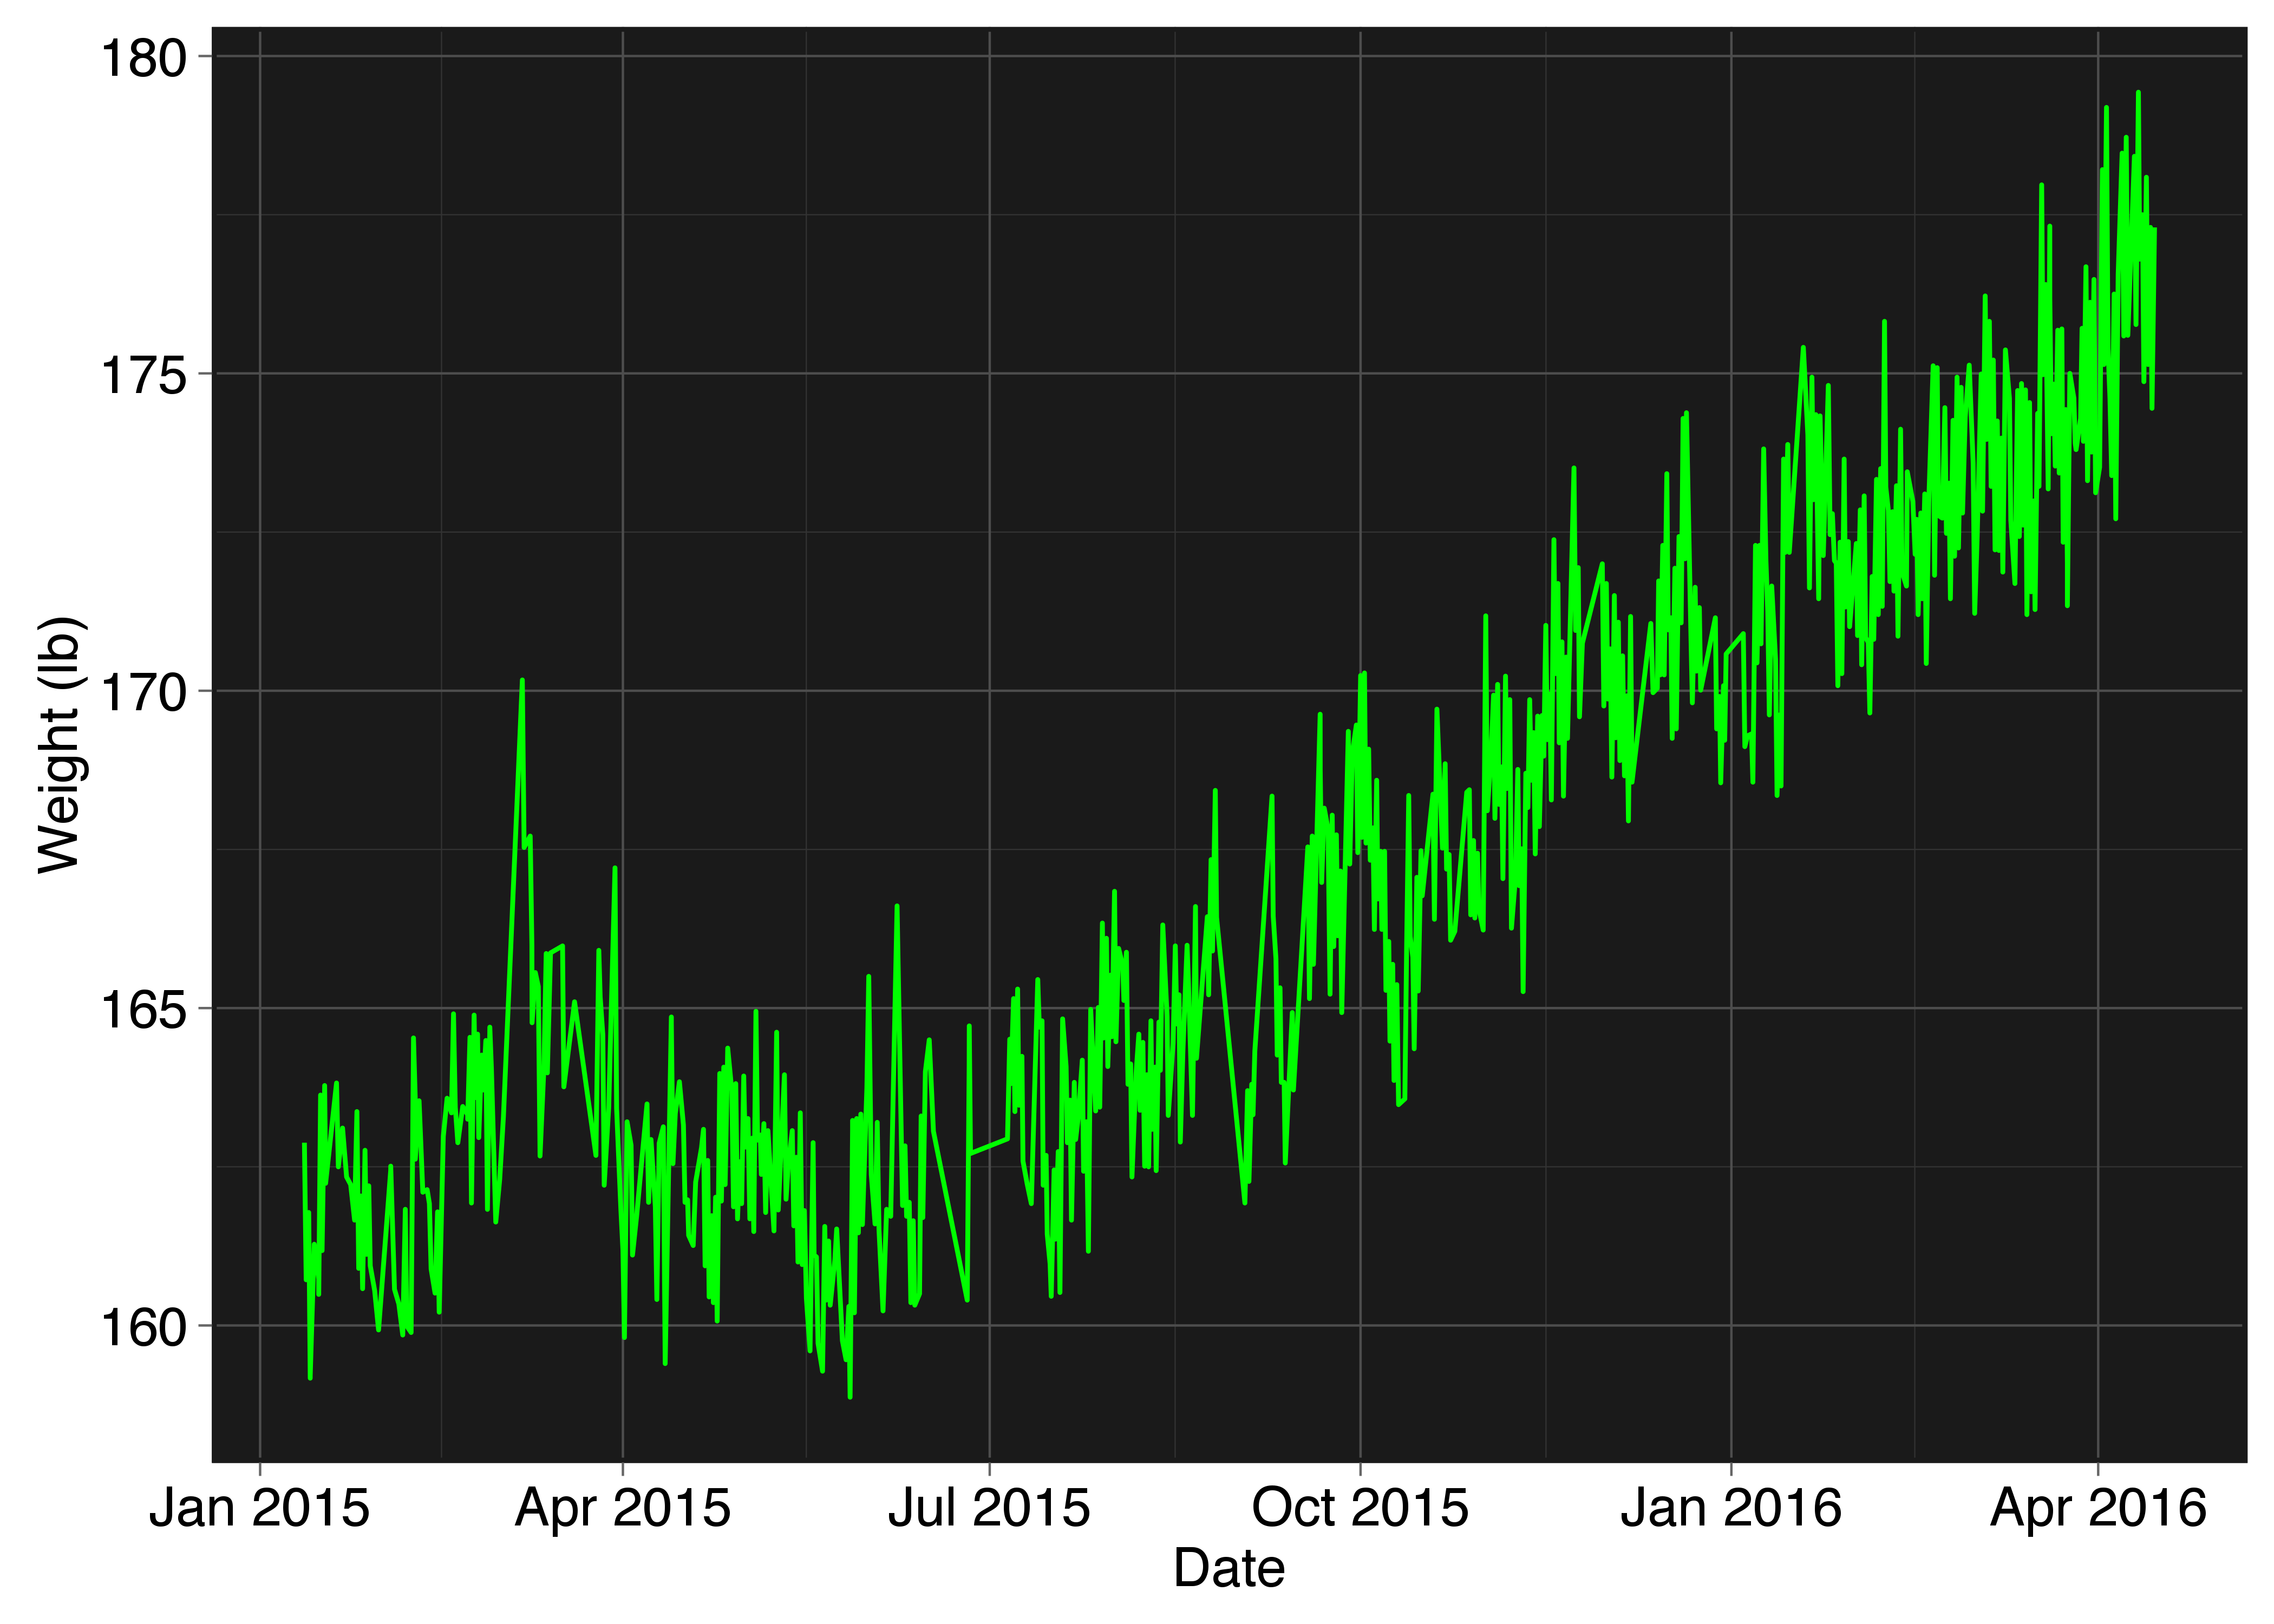
In a world of vague promises of 6-minute abs and 60-day full body results (guaranteed!), a scale a remarkably simple tool that allows you to cut through the madness and see what actually works. However, a simple scale’s failures quickly become apparent when you goal becomes more complex than losing weight. After defending my thesis in May and starting a desk job in July, I started to see my weight slowly creep up last summer. I decided to take advantage of the “slow bulk” I saw myself inadvertently doing and start working out to try and gain muscle in October. Here is the plot of my weight over that period:
Once I almost hit 180, I was feeling a little inflated and although happy with my strength progress in the gym, somewhat dissatisfied with my current body composition. I decided that I had “slow bulked” enough. I cut down my daily calorie allotment with the goal to lose weight and decided to go “mid-to-low carb”, basically turning down opportunities to eat carbs when they came up outside of a meal, unless the desire was strong enough. It wasn’t easy, as avoiding sweets and baked goods when offered is harder than I’d rather admit, especially in the middle of the work day. But adopting the attitude of consciously deciding every time that I really wanted that brownie or cookie that I could have it–rather than just eating it by default or out of boredom–made the times I do decide I want it much more enjoyable. And, thanks to the power of the scale, I know it’s working great:
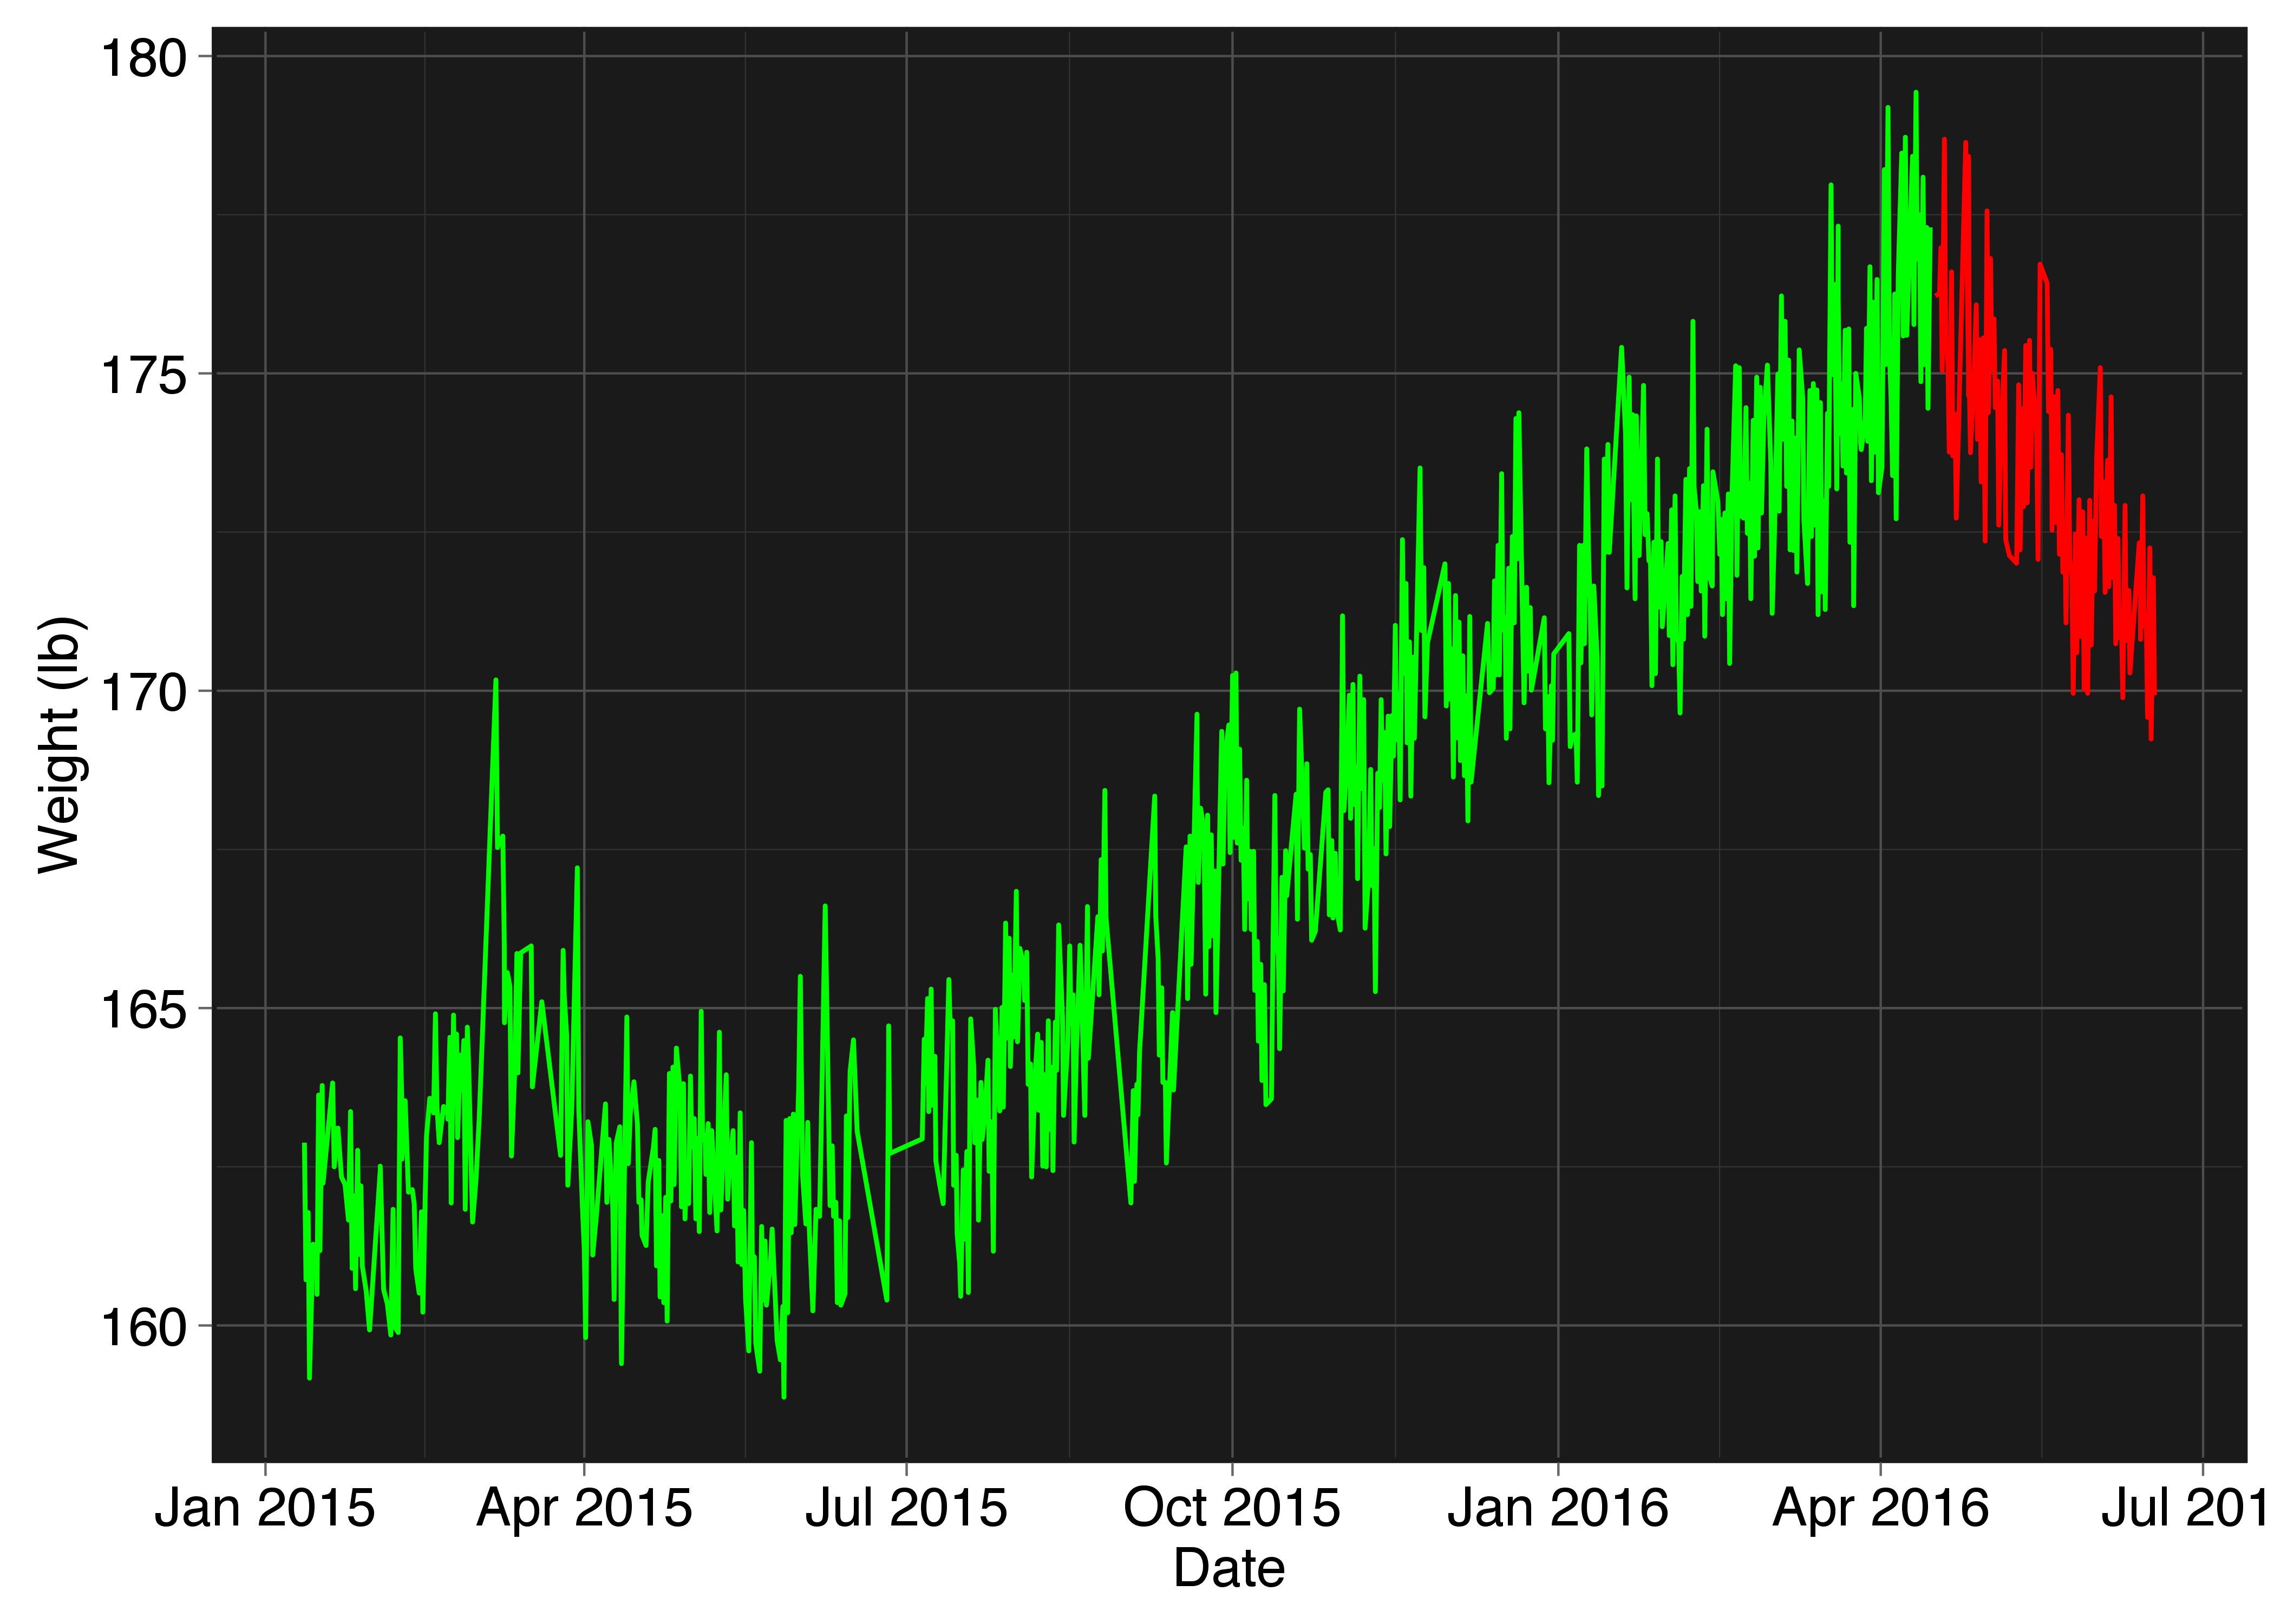
The scale told me what I did was working, and now I know exactly what I need to do if I want to gain weight at a certain rate, or lose it at a certain rate. However, my goals were never just to lose weight: I started working out back in September with the intent on gaining muscle. Luckily, this scale tells me my body fat percentage, so technically I should be able to tell how much of the weight I gained was muscle vs fat, and how much I manage to keep when as I lose weight. Indeed, I did this at the end of this post, and the results are pretty cool. But first, let’s figure out if we can trust the body fat percentage numbers.
Consumer scales that read body fat percentage all do it through the same method: bio-electrical impedance. Fat is an insulator and your lean body mass conducts electricity, so by measuring the resistance of your body from one foot to another, it uses that information to deduce how much fat is in your body. However, this number is also affected by other variables. Hydration is a big one, where the more hydrated you are the less resistive your body is. This can lead to misestimating your total body fat. In addition, the Withings Smart Body Analyzer Scale (which is where all the data in this post came from) manual states that the liquids in your body take a while to adjust after waking up, temporarily altering the distribution of water in your body and thus creating inaccurate measurements. So how accurate are these scales really?
I decided to see how substantially dehydrating myself affected my body fat percentage measurement.
In the grand tradition of scientists performing experiments on themselves, I decided to see how substantially dehydrating myself affected my body fat percentage measurement. This involved fasting and avoiding all food, water, and other beverages all day long. Including coffee, so this informal study probably wouldn’t have passed an IRB board due to crimes against productivity. Anyway, the plan was to weigh myself several times in a dehydrated state, drink 16oz of water, weigh myself again, drink more water, and continue until my body fat percentage reading leveled off or I suffered acute water poisoning. Once full, I then would measure my body fat percentage over time to see if it’s purely the amount of water in my body that affects the body fat measurement or if it indeed is the distribution of water (which would result in my body fat percentage changing over time, after I had stopped drinking). Finally, after peeing out the water, I would weigh myself and use the difference in weight to calculate the remaining water left in my system and my subsequent body fat percentage.
Here’s what the weight vs time graph looks like, colored by amount of water left in my system and the mean of each measurement indicated by the line:
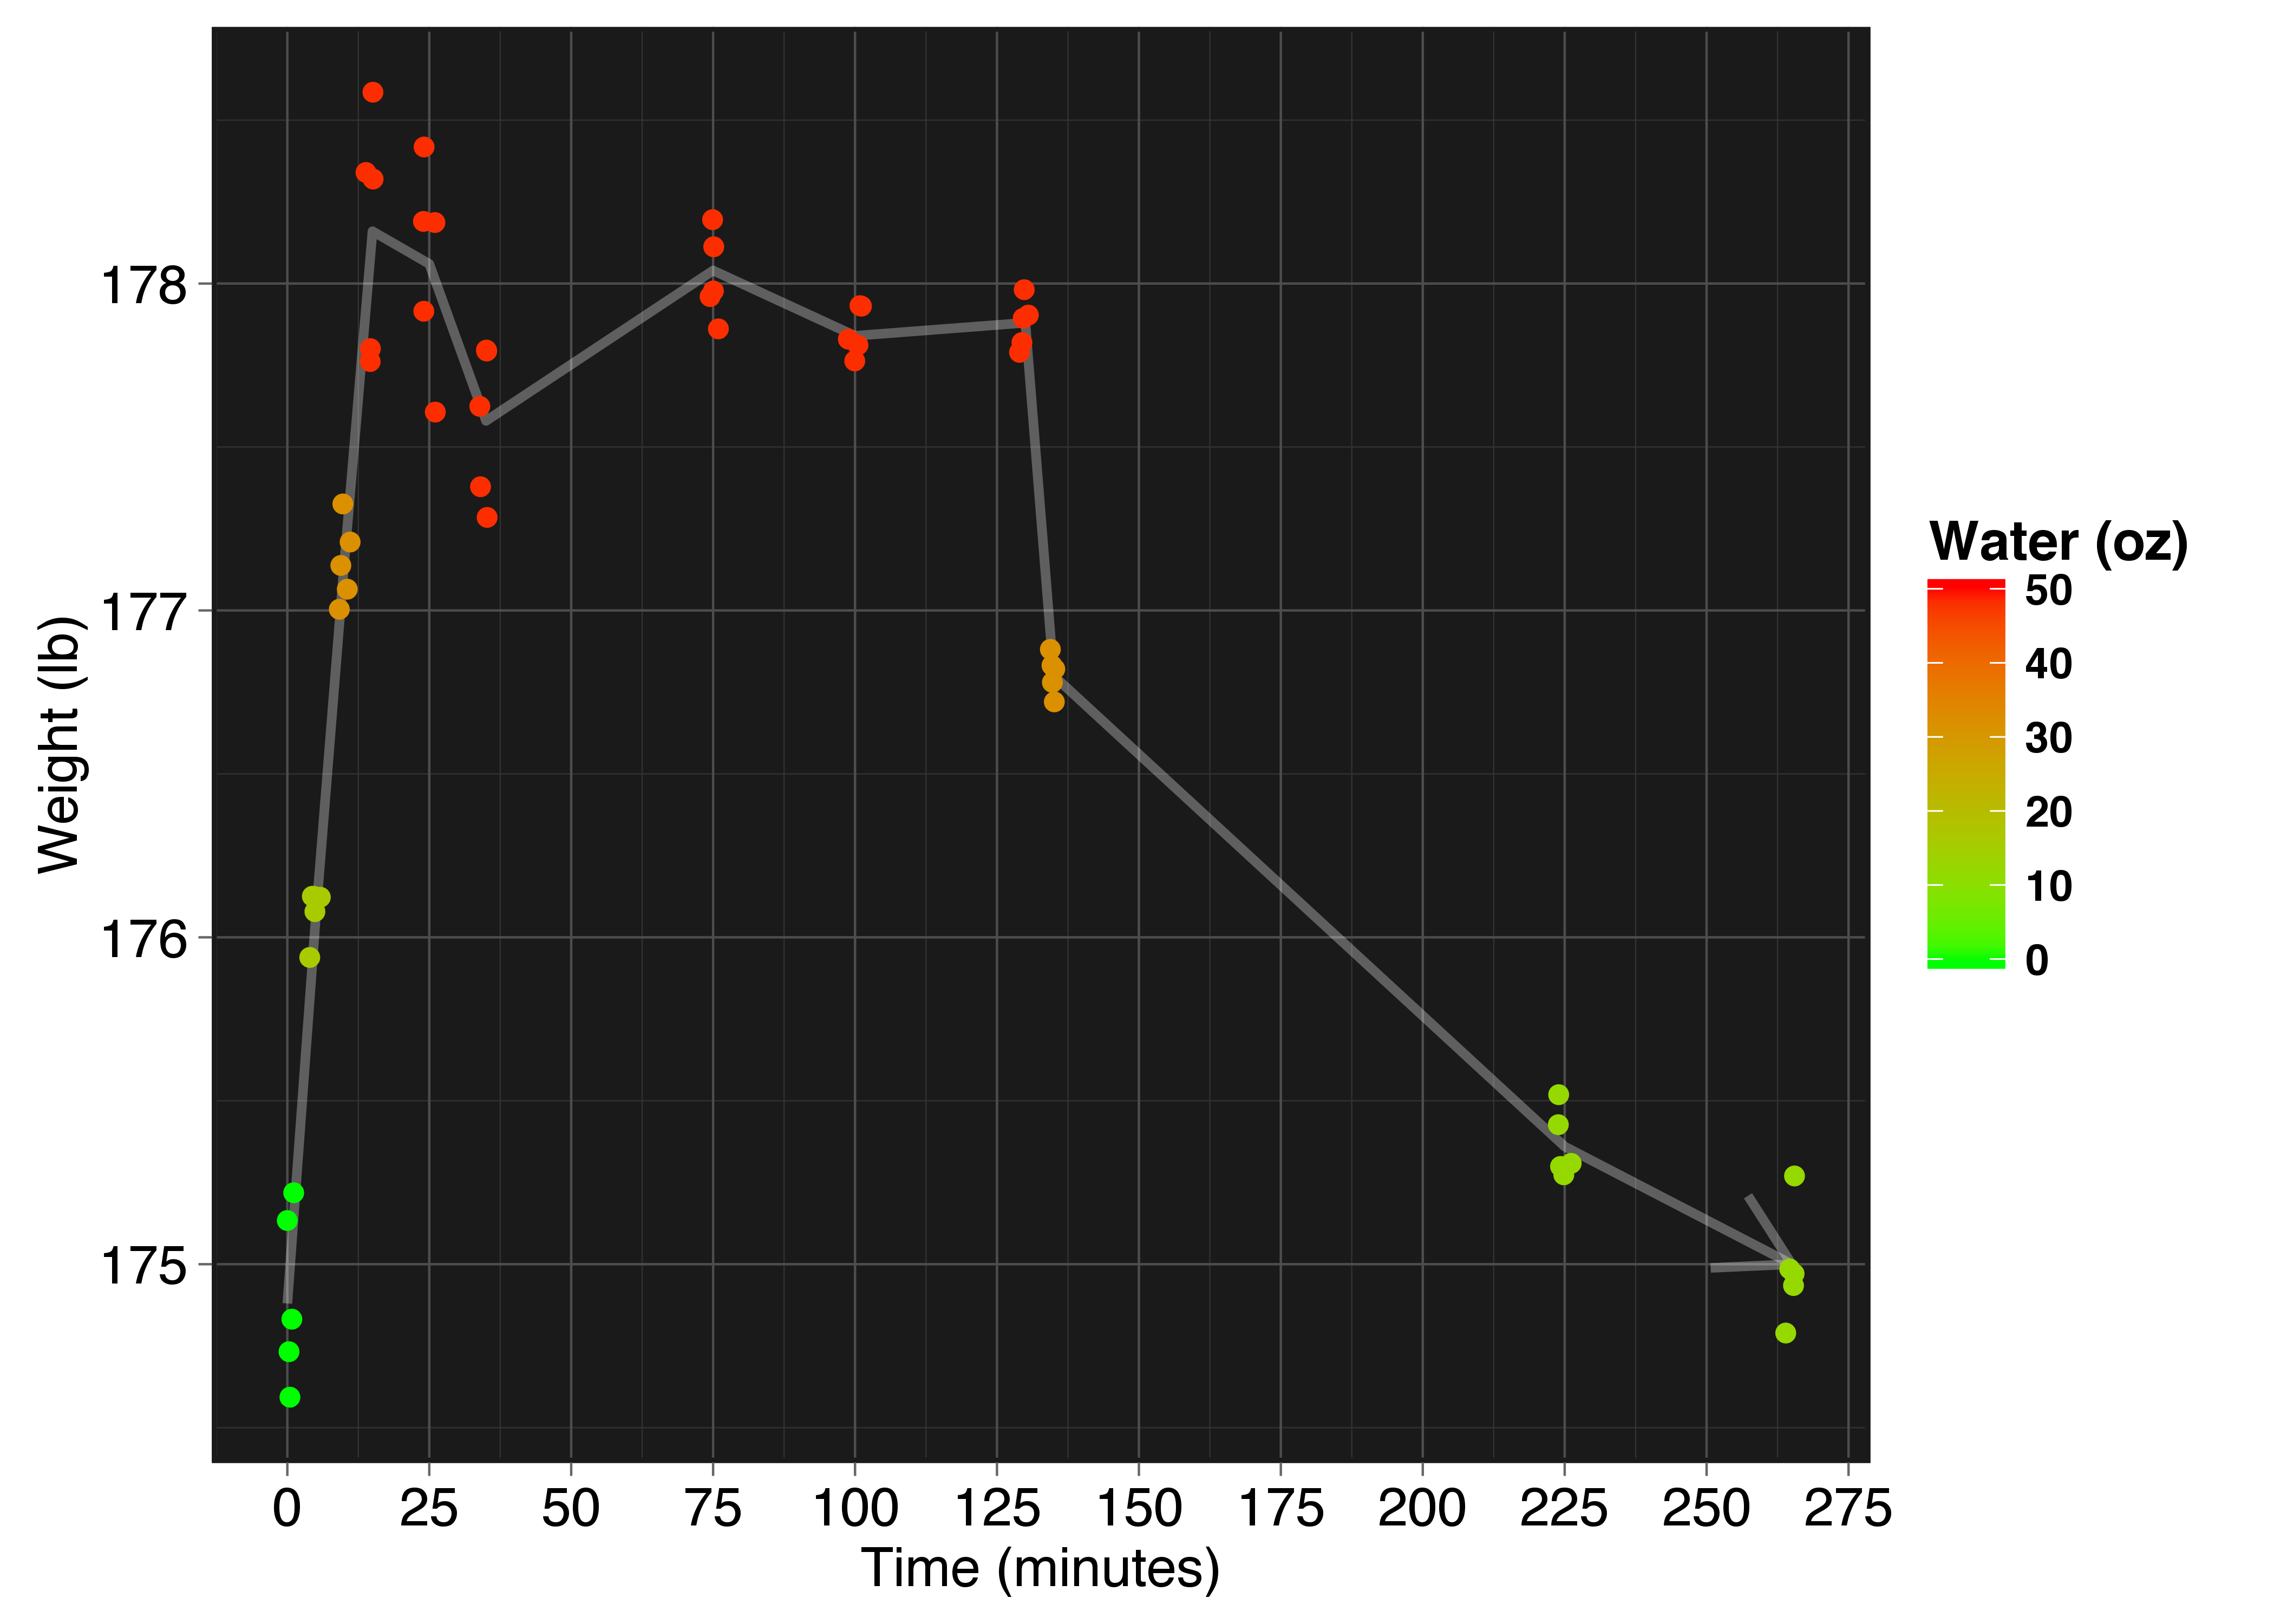
As you can see, I drank a total of 48 oz of water and gained the expected ~3.1 lbs for that amount. I stopped at 48 oz because, as you will see in the next graph, my body fat percentage did not seem to change much between 16 and 32 oz. I used the bathroom at 130 and 225 minutes, and used the difference in weight to calculate the amount of water remaining in my body. Now let’s look at how my body fat changed over time:
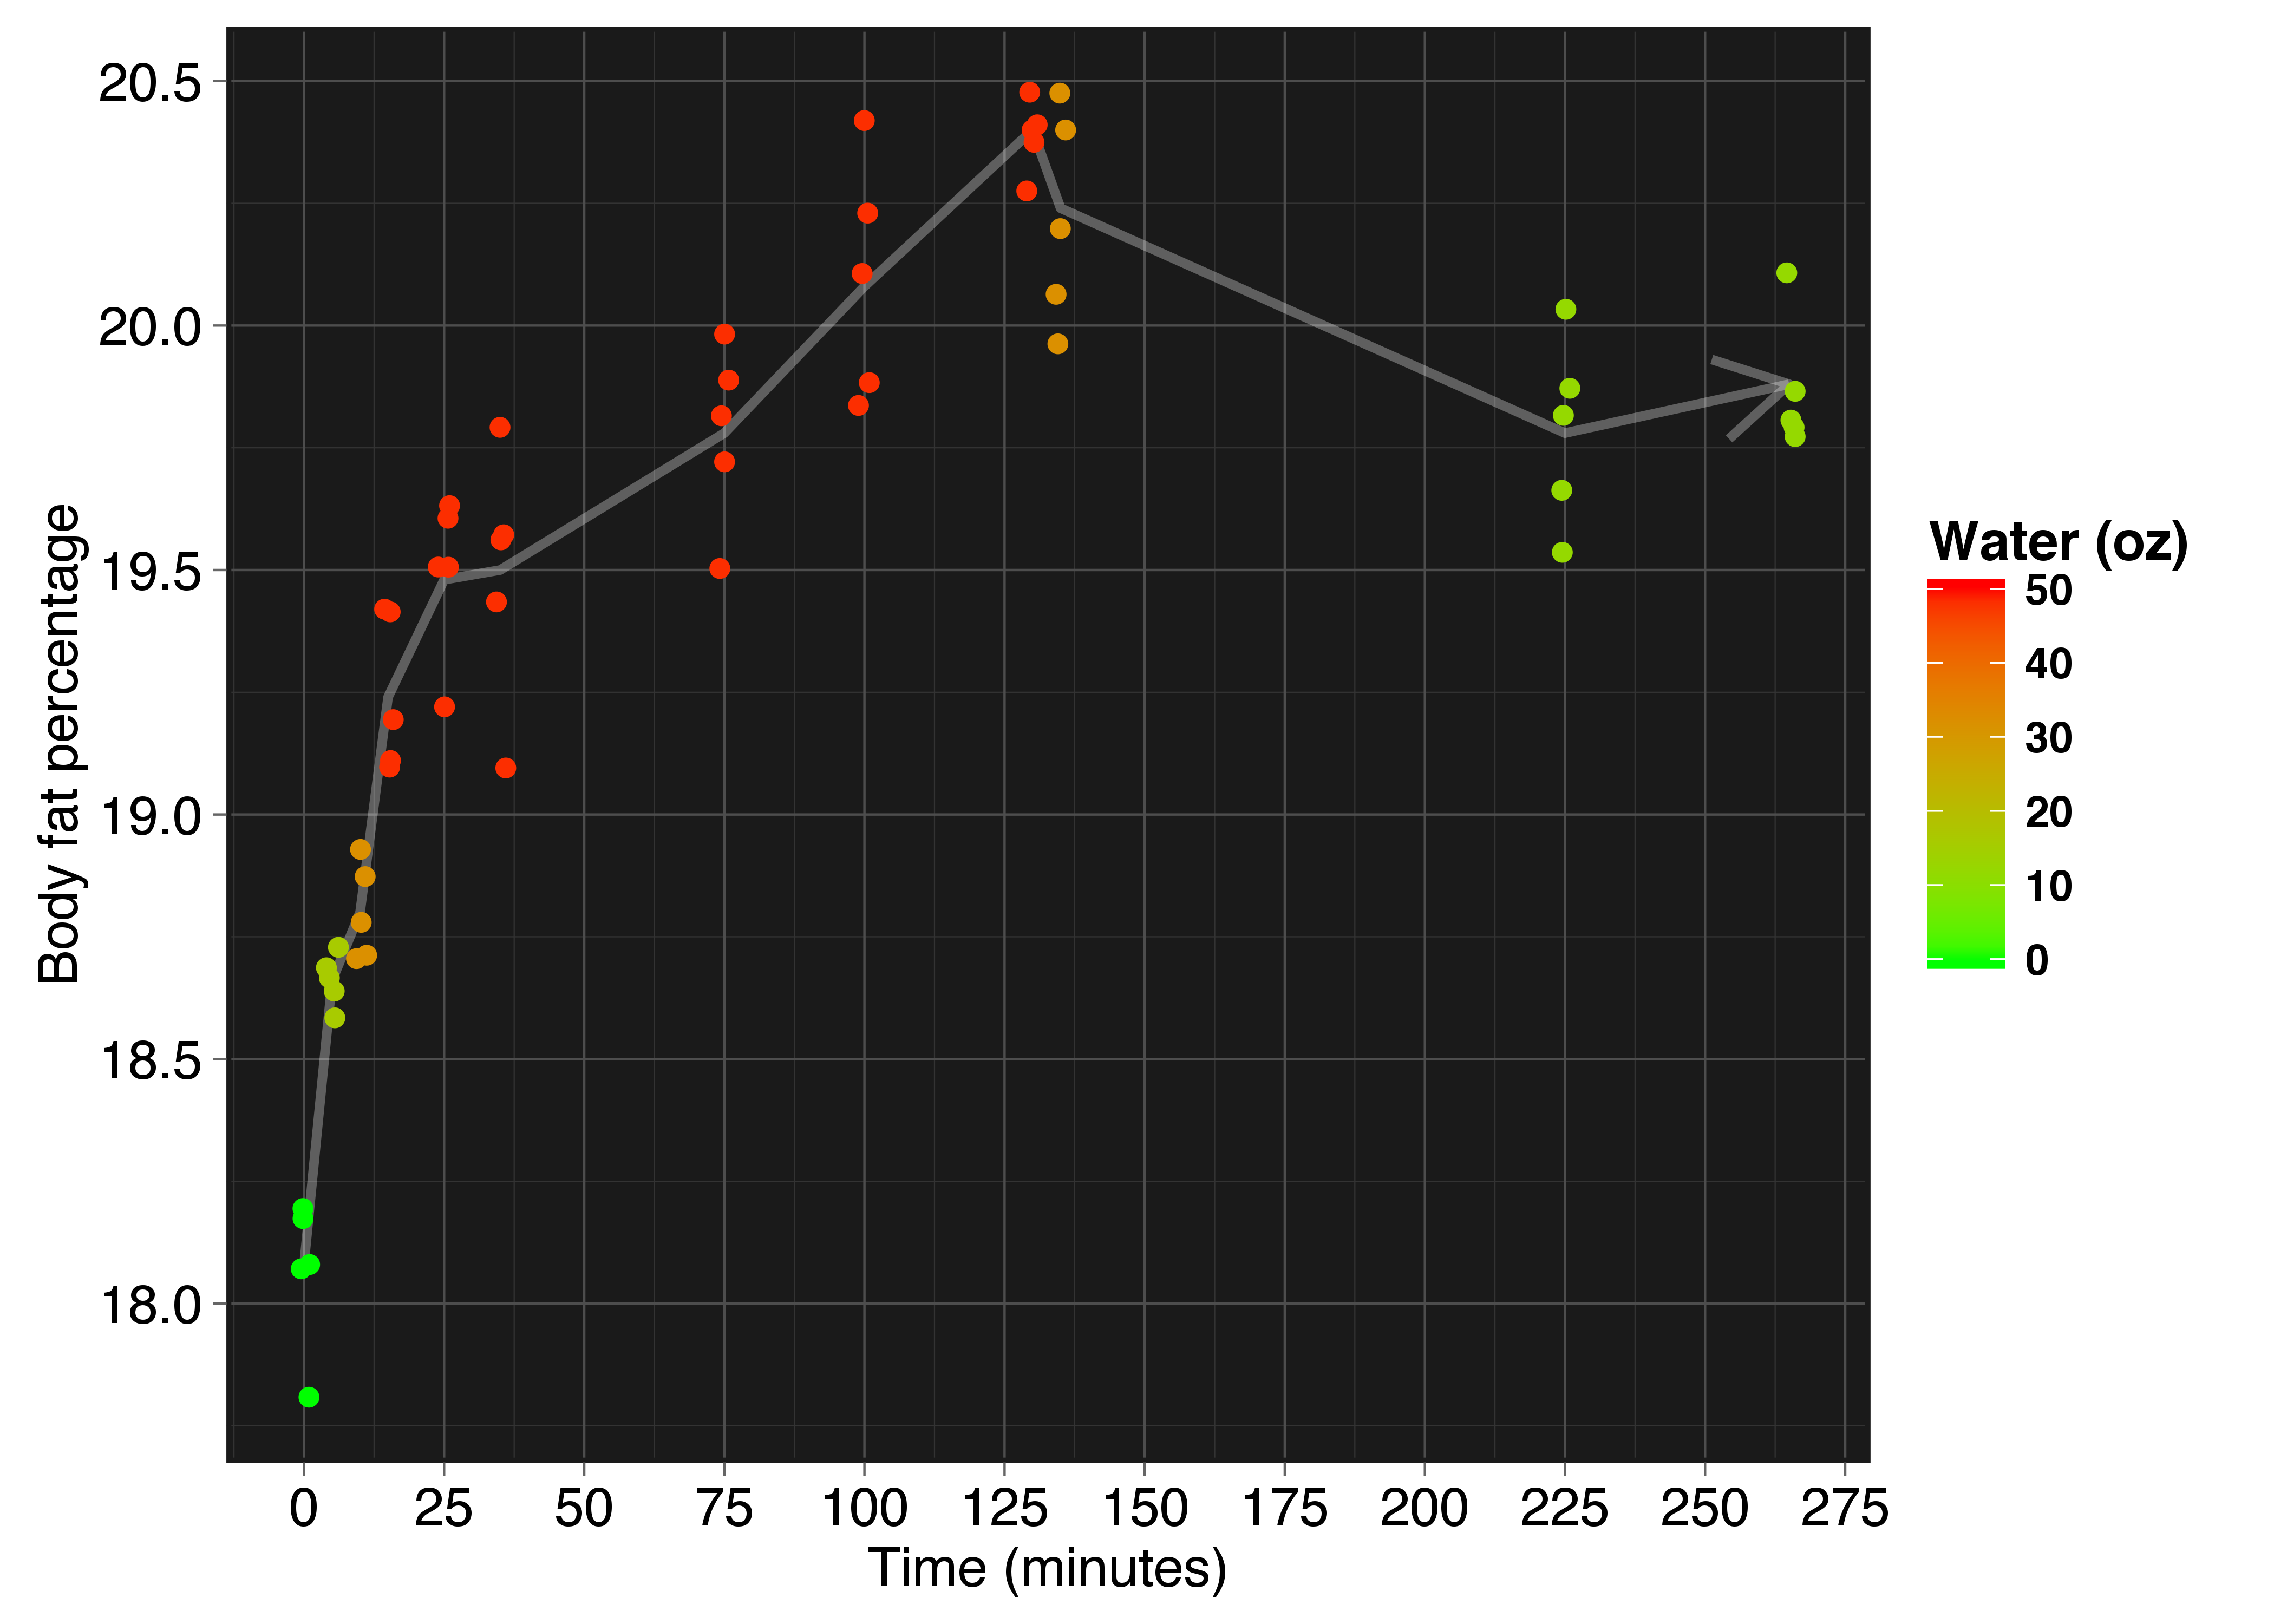
There was a large initial jump with the first and last 16 oz of water, but a slow and steady increase even an hour after I finished drinking. This confirms that it’s not just the presence of water in the body, but rather the distribution of water throughout that affects your body fat percentage reading. This was confirmed after some review of the literature, where it was was suggested that “due to the large cross-sectional surface of the trunk, even fluid intake of up to 2L is shown to be”electrically silent” during the first hour after consumption5,6“.
The following is body fat percentage as a function of weight, showing how my weight and supposed body fat weight changed over time (marking the amount of water in my body over the baseline and the time since the first measurement):
Or, in a non-animated format, with total body fat in place of the percentage:
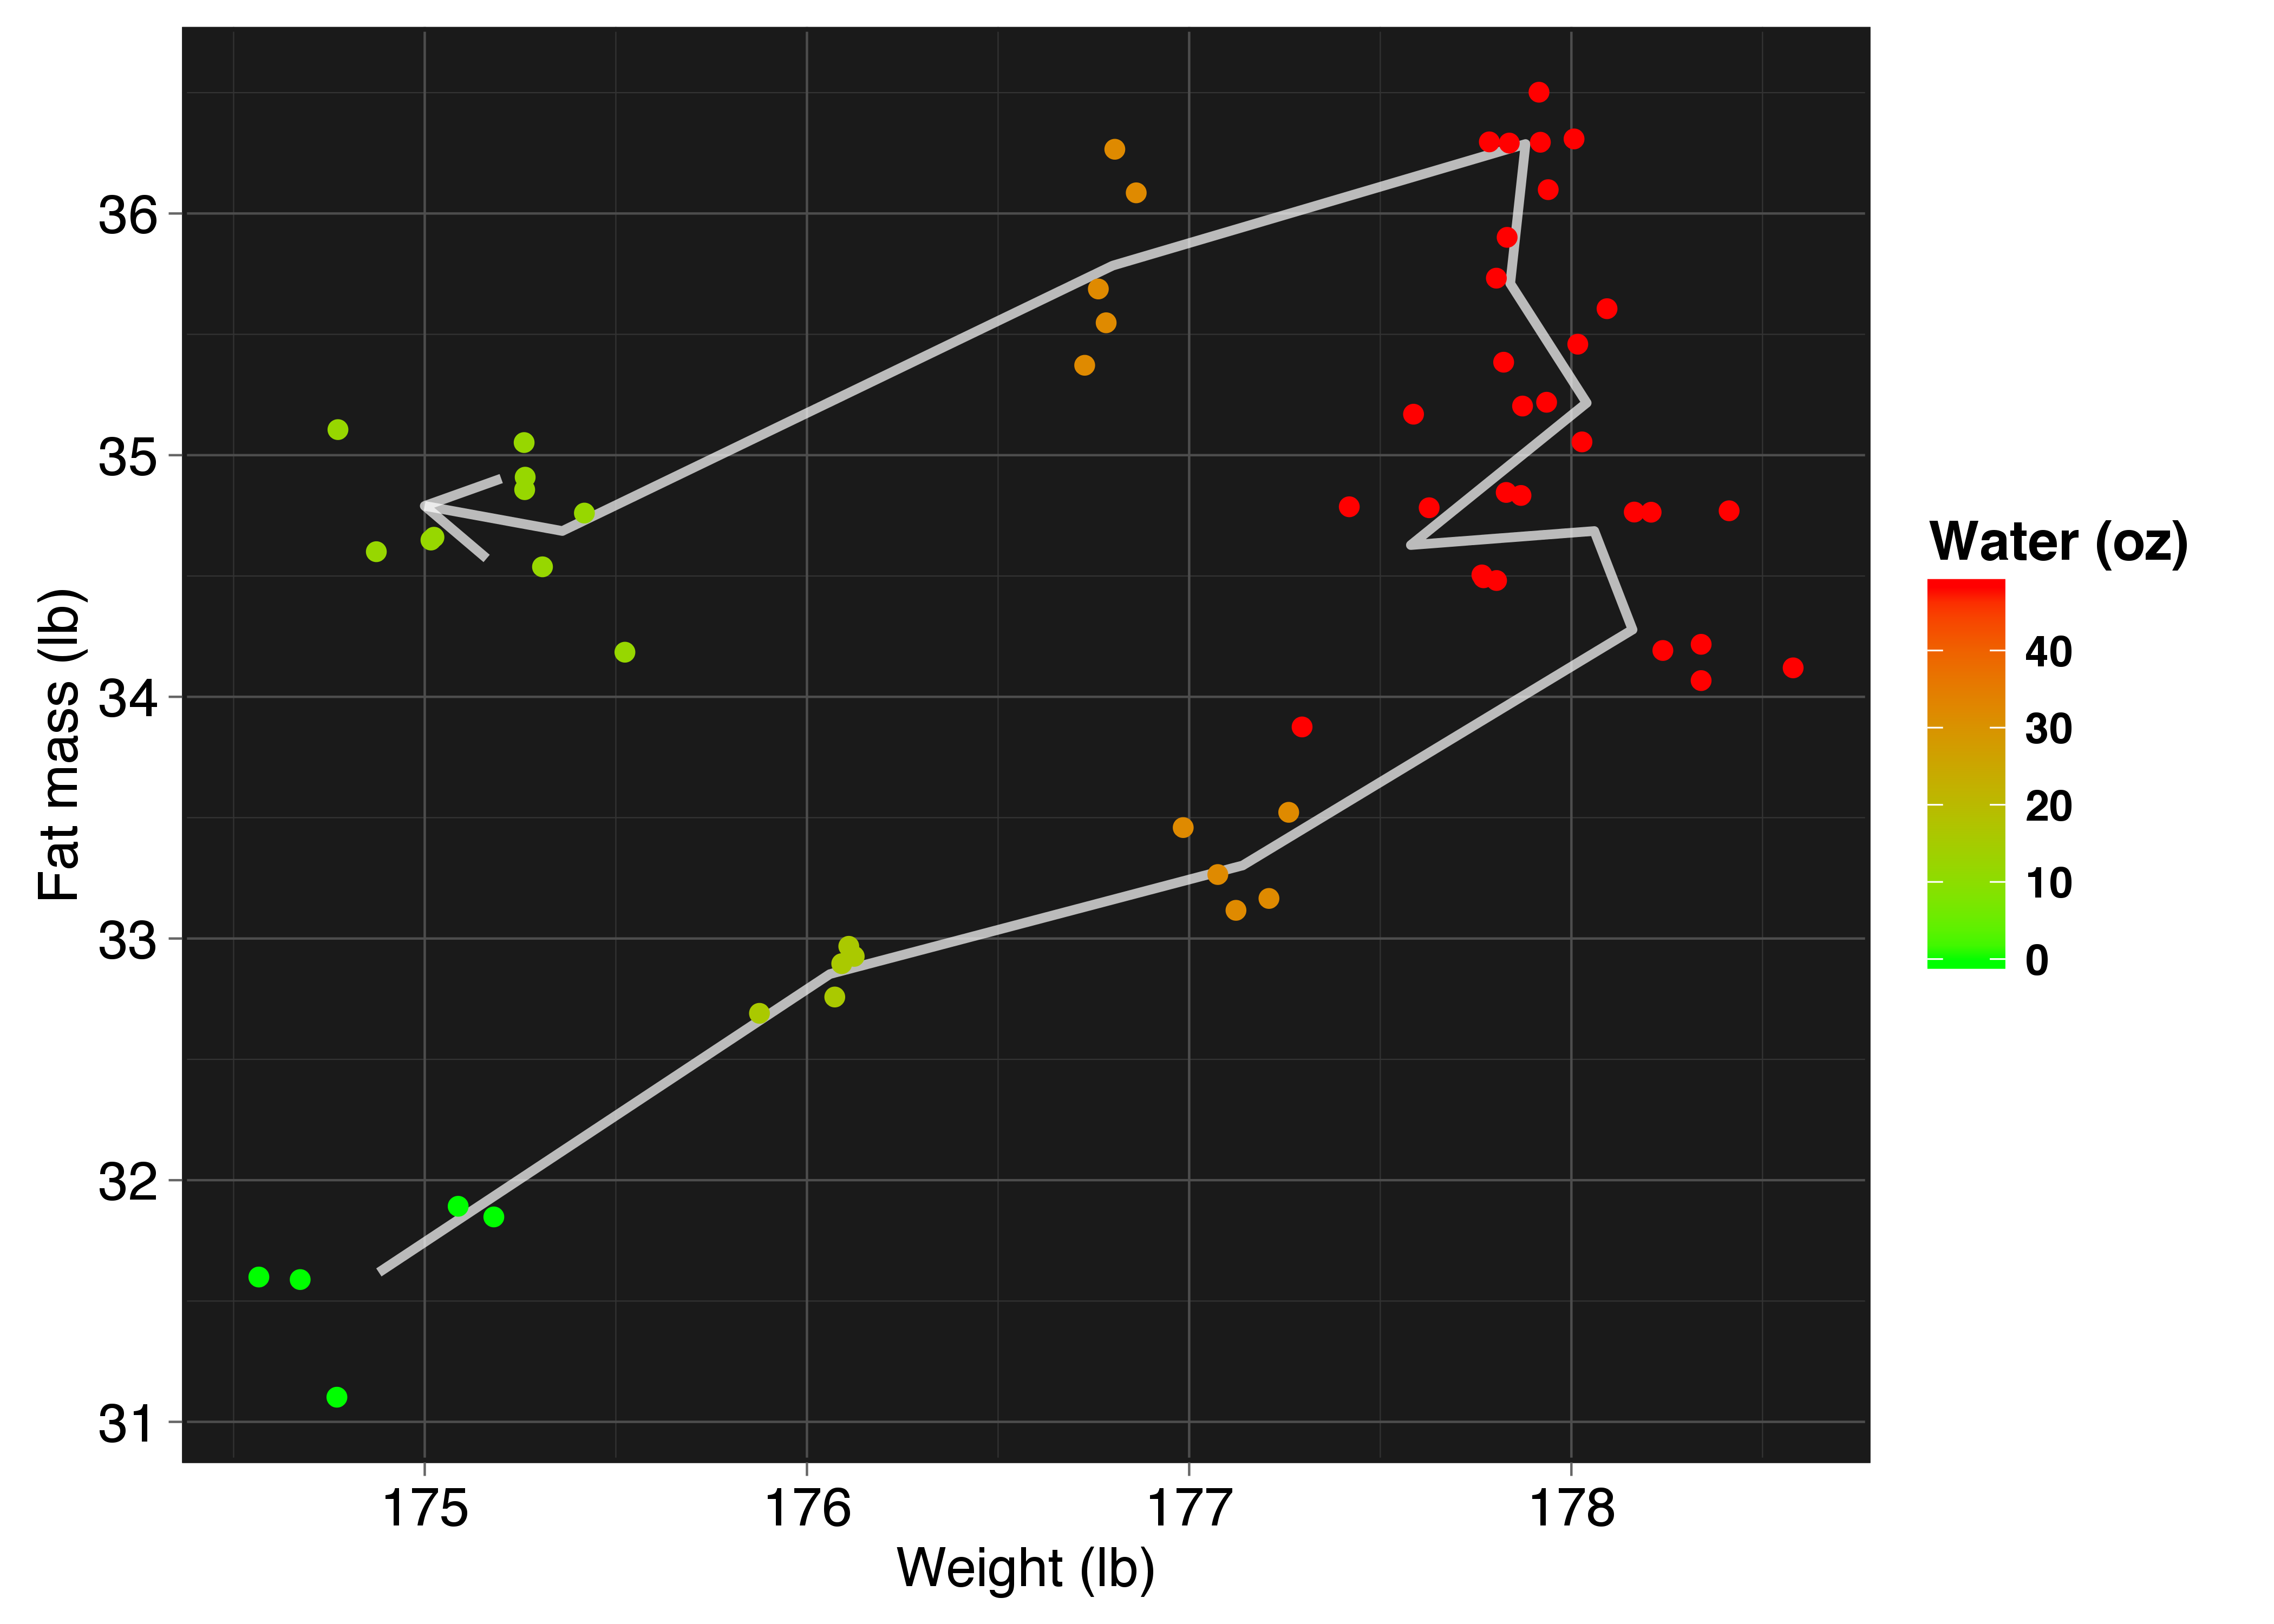
You can see that being dehydrated ends up underestimating the amount of fat on my body. As my body’s water content goes up, so does it’s (supposed) fat content. This is the opposite of what you’d expect if it was purely based on electrical impedance, since the added water should lower my body’s conductivity. This could possibly be explained by noting dehydration also change the your bodies electrolyte balance, which potentially could have increased the impedance measurement. In addition, there’s a slight overestimation of bodyfat when I was over-hydrated, but not nearly as large as the effect of dehydration. But the takeaway is less about the individual variation, and more about the major assumption that these scales make: these scales use the electrical measurement assuming your body doesn’t deviate from the norm in any major way, other than fat content 7. Any major difference from the standard day-to-day “normal” body will degrade the output from the scale8. Being dehydrated was a major deviation, so it decreased the accuracy of the results. Withings explicitly accounts for this if you happen to be an extremely athletic person, where turning on “Athlete mode” just subtracts 5% from your body fat percentage because that’s how much the reading can be off if you’re much fitter than the average person.
In addition, specifying where you live and even your ethnicity can significantly impact the accuracy of your body fat measurement. As a example, since limb proportions vary between regions9 and body impedance is mostly a function of the limbs, these population differences need to be accounted for or else the reading will be inaccurate. In addition, it has been shown that the proportion of fat deposition (where fat is distributed around the body) on trunk varies by 5.7% between different ethnic groups of Asians, Mexican Americans, Caucasians and African Americans, which can affect the validity of the body fat percentage reading10.
The other major variable that influences body fat measurements is the time of day at which you measure yourself. The Withings manual recommends waiting 30 minutes after waking up because fluids take a while to redistribute after you have been lying down for a while. I found this odd, since I had always thought of the human body more like a big sack of water balloons: the arrangement of water balloons changes as you shift it around, but fairly quickly reaches an equilibrium. However, this was wrong, as shown by a series of body fat measurements over the course of a week:
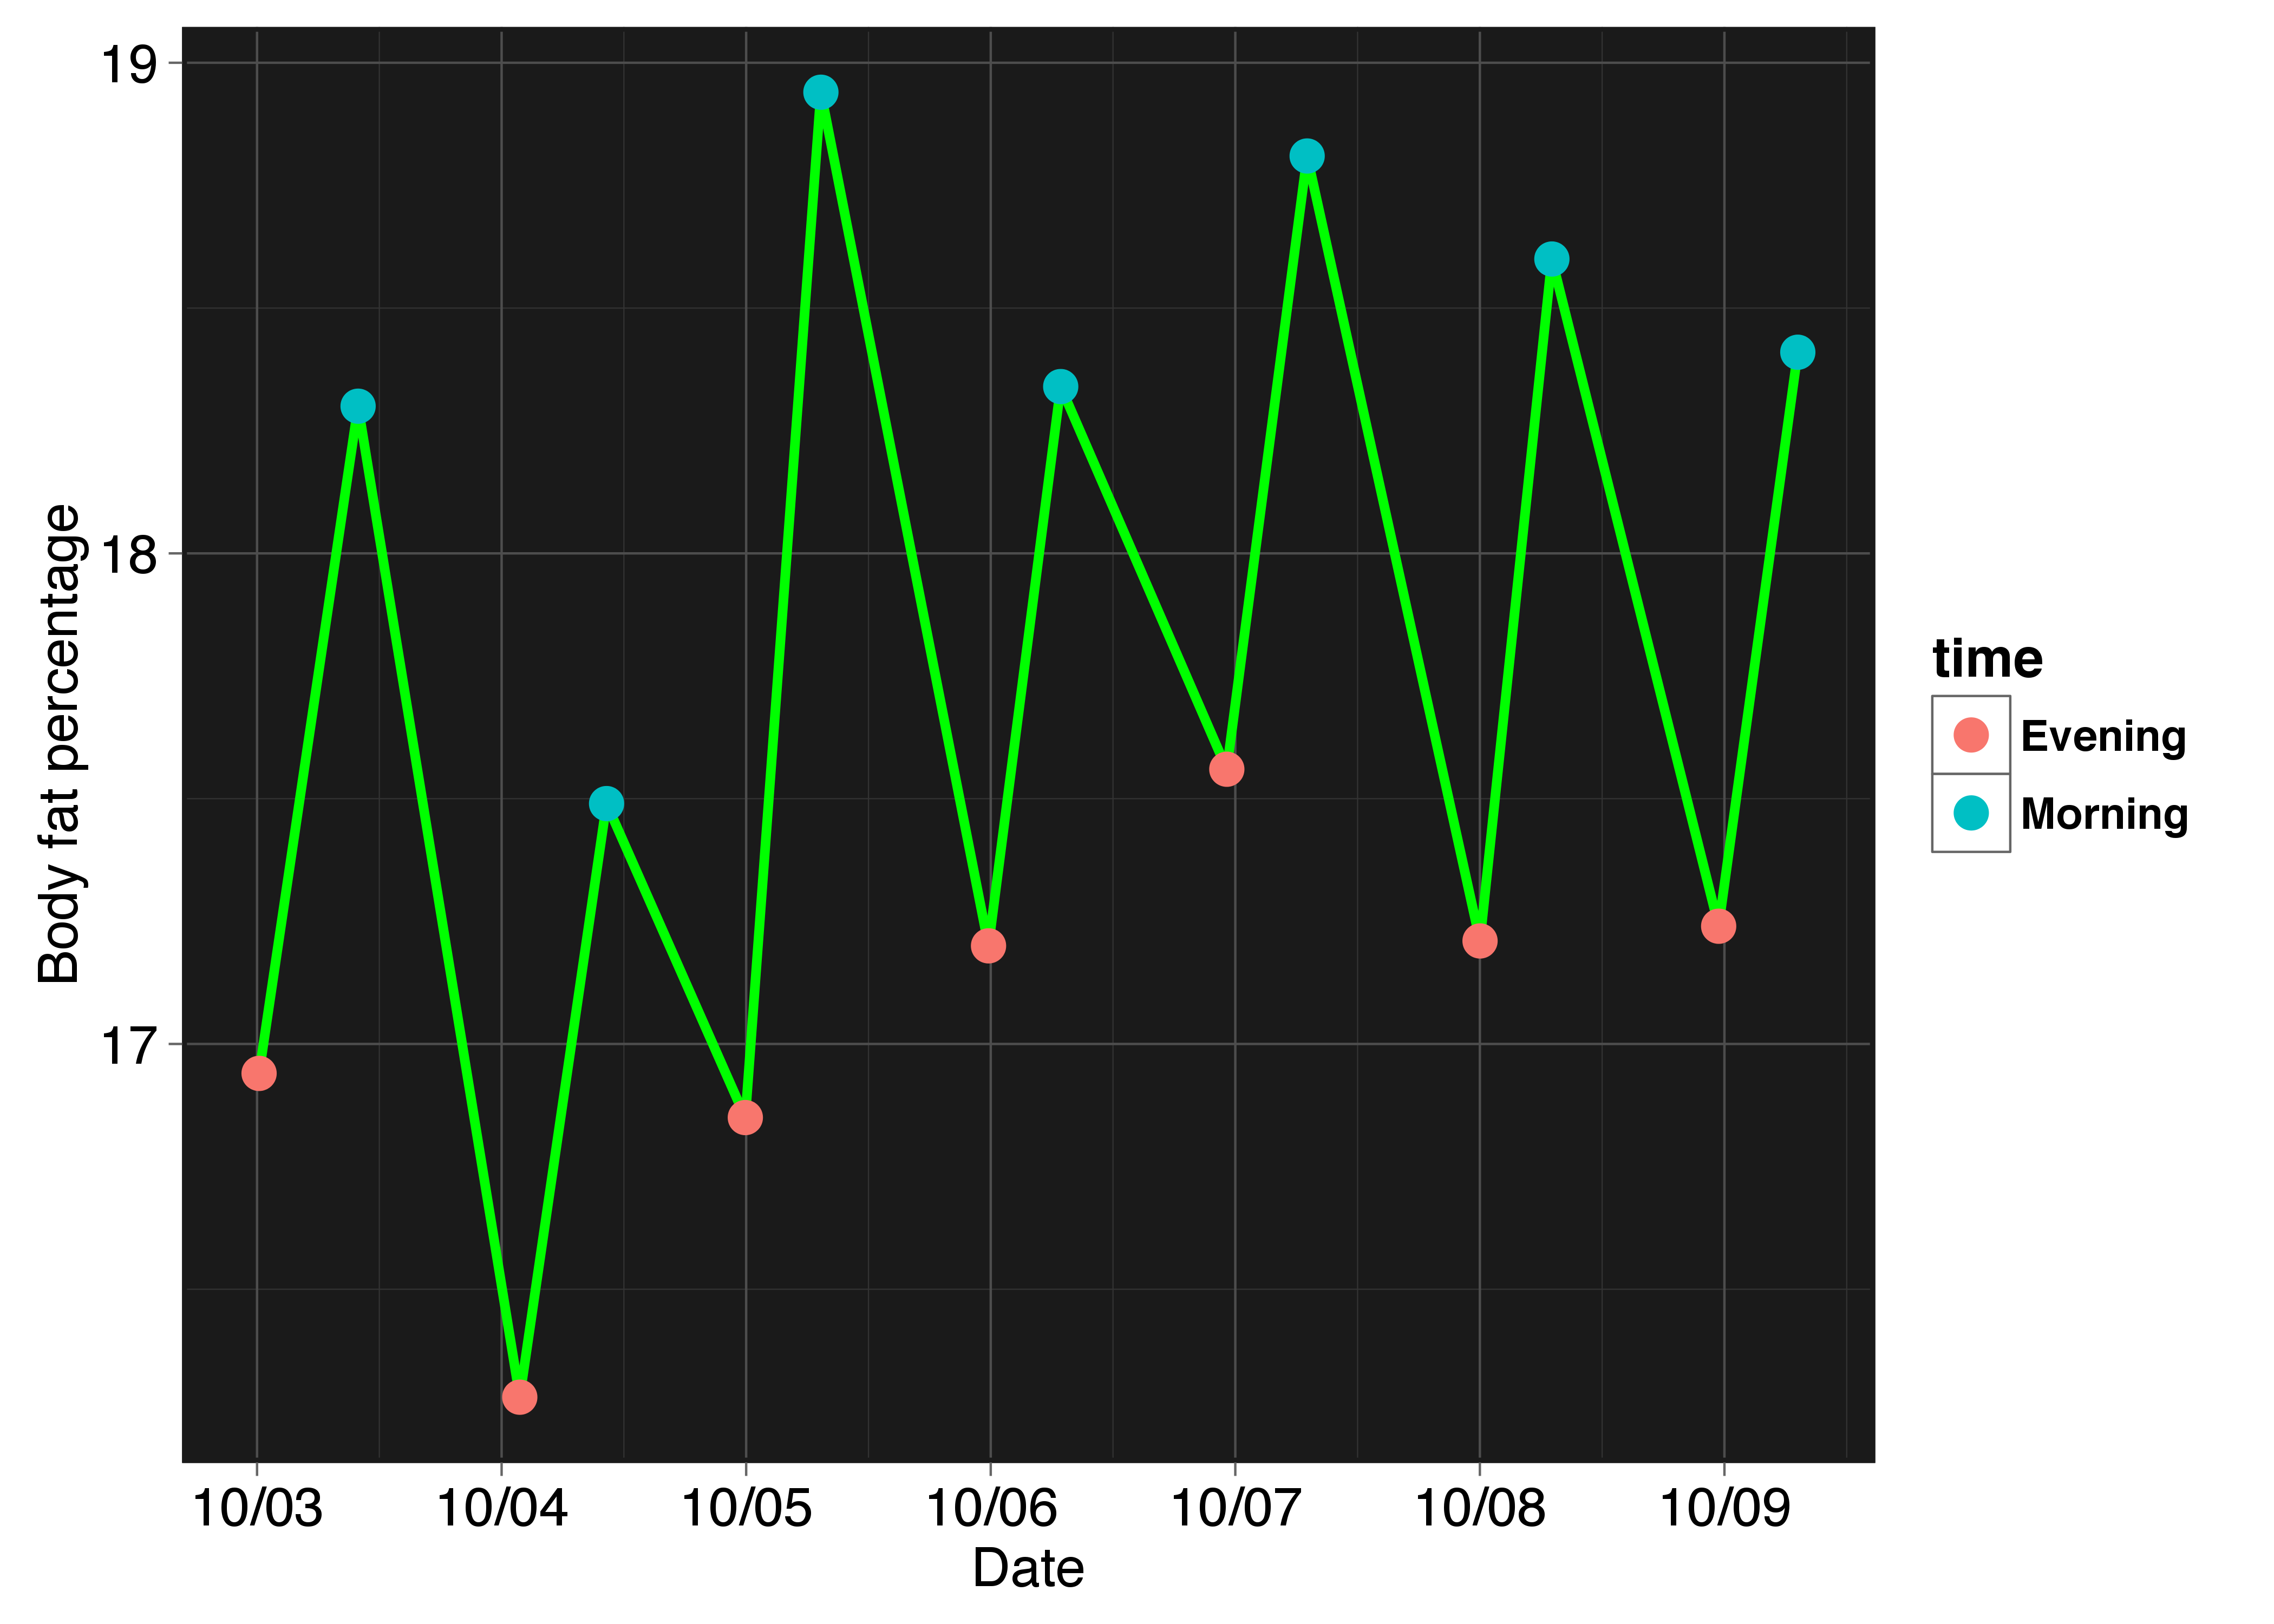
If the shift in body fat percentage was truly just due to the dehydration from sleeping for 8 hours, we should expect a decrease in body fat percentage in the morning, as seen by the prior analysis. Instead, we see an increase, and the only reason I can think of is they are indeed right; the fluids in my body are truly taking a while to reach equilibrium. If we take a subset of the scale measurements that have a night/morning-after pair, we can calculate the average difference from this equilibrium issue:
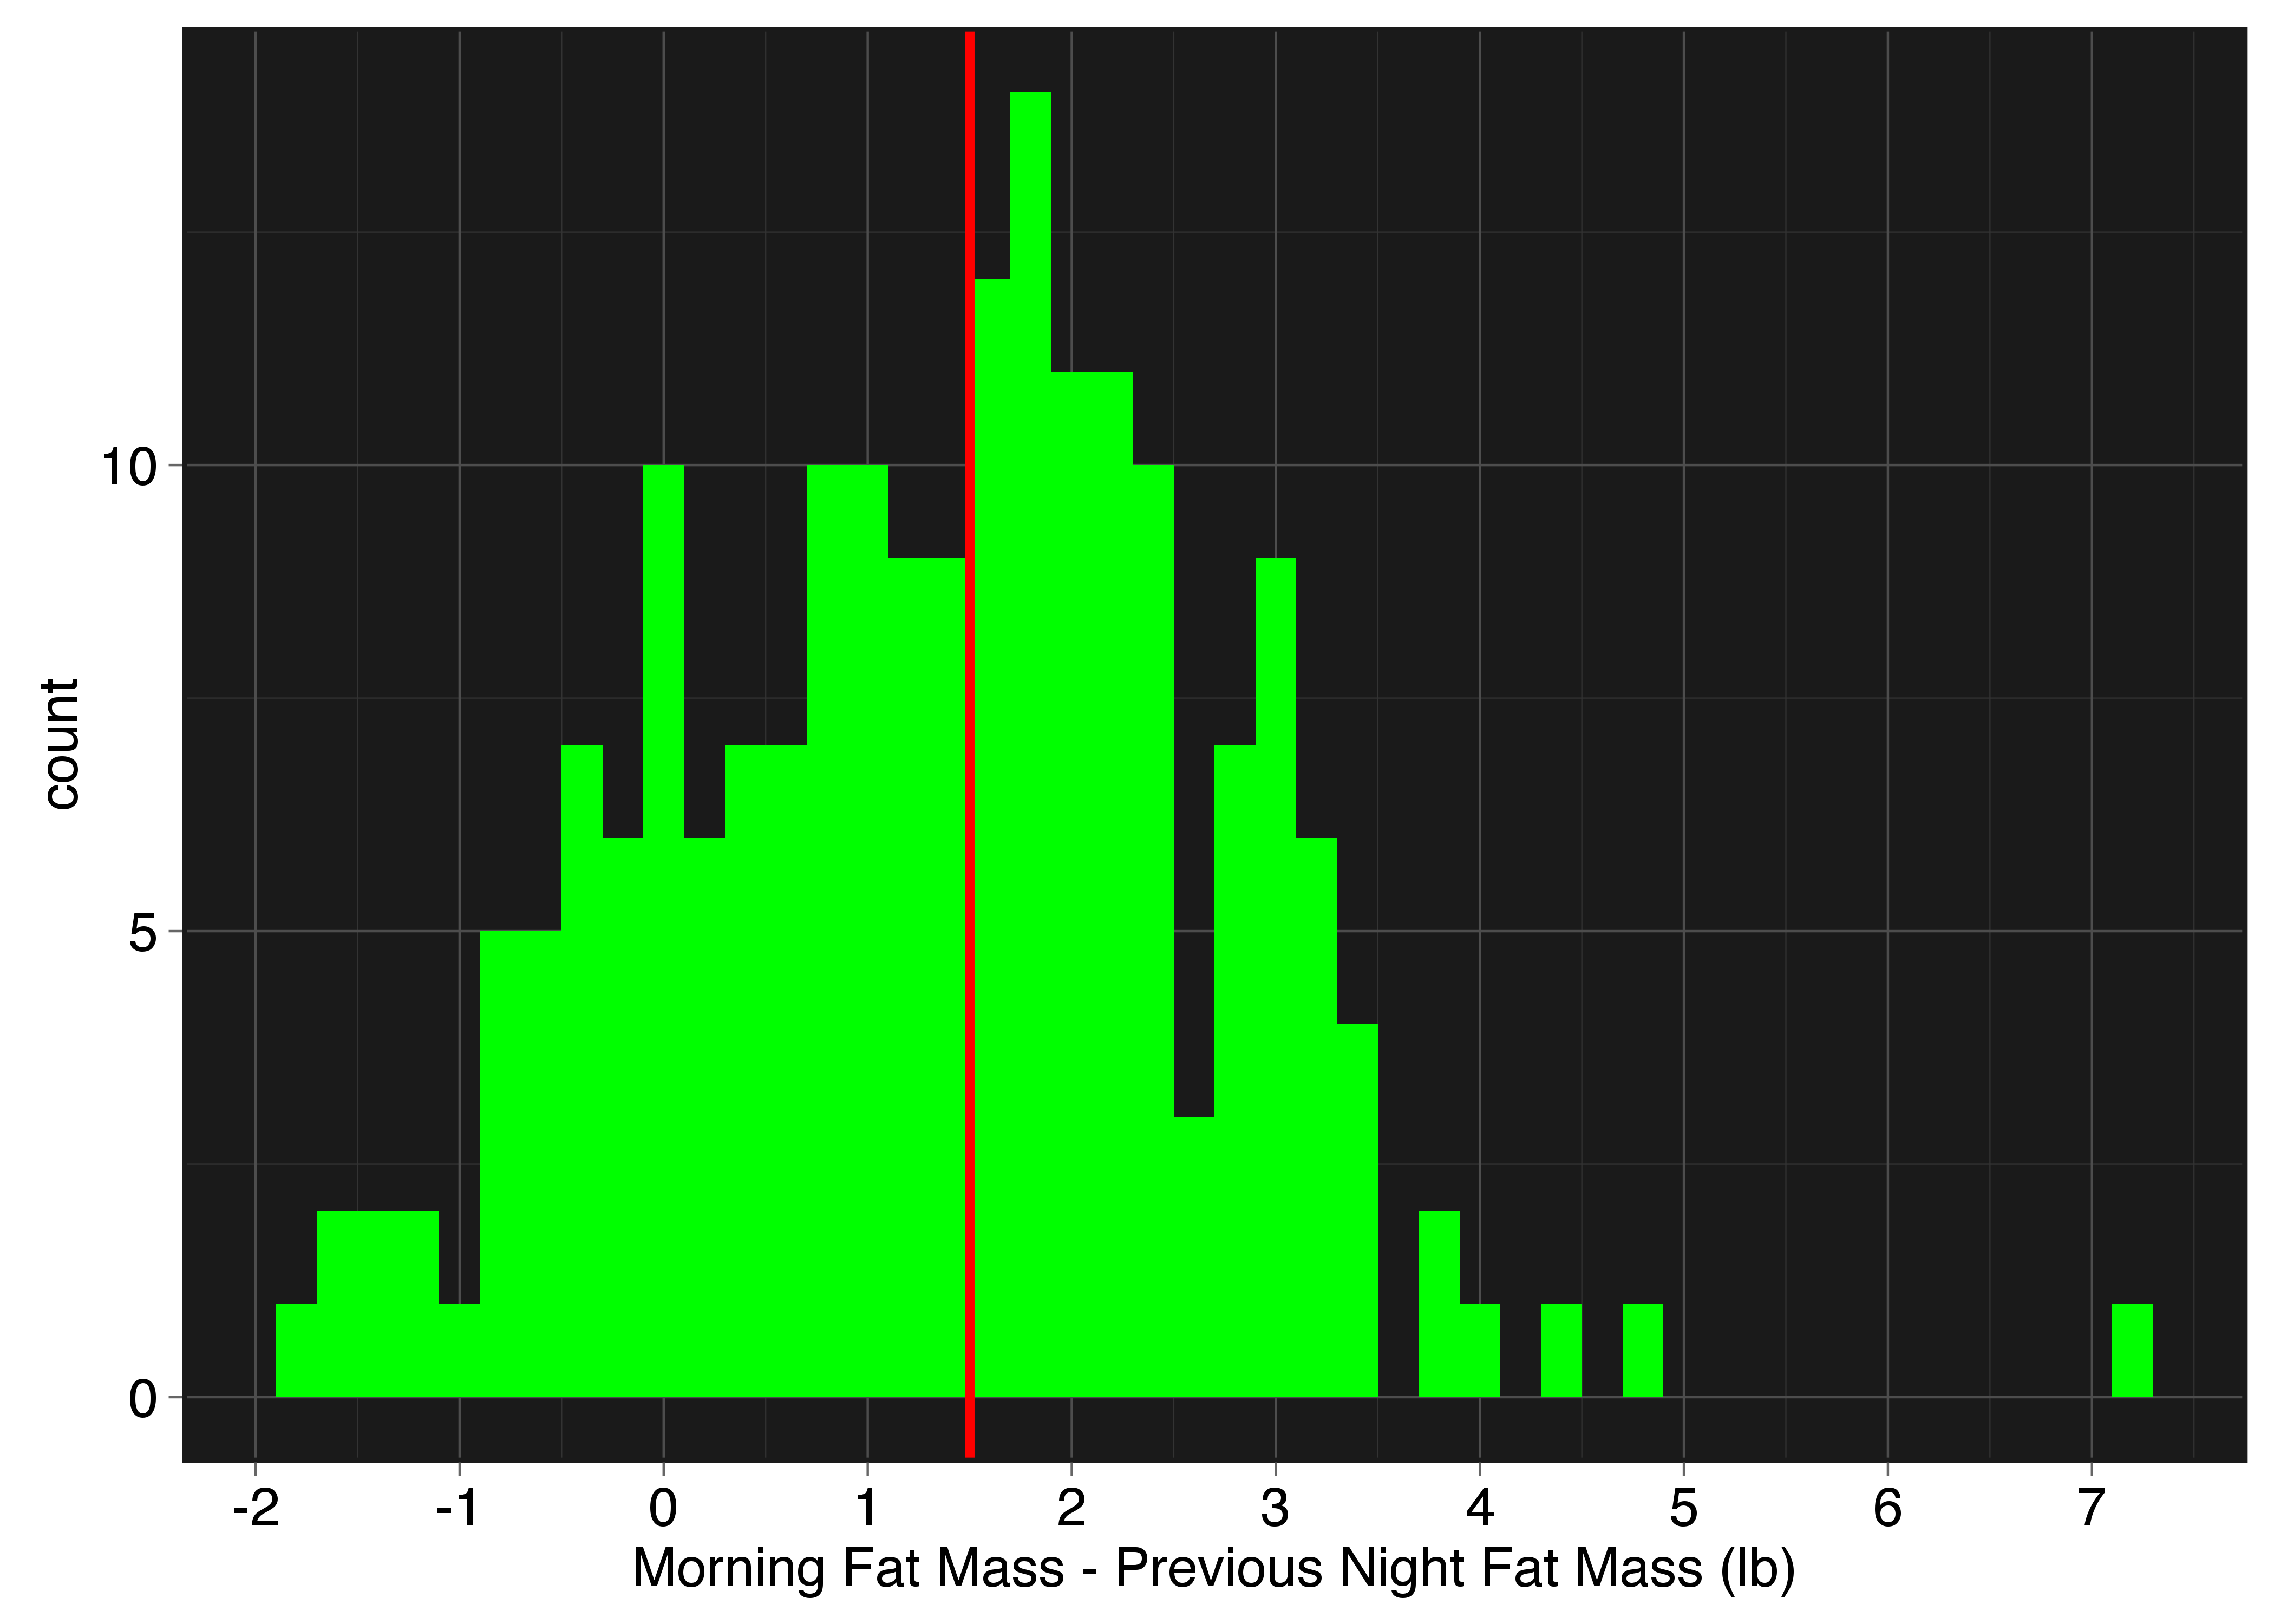
and we see the morning fat mass measurement overestimates body fat as compared to the night fat mass measurement by an average of about 1.5 lbs (for me), or about 1%.
We can also get a good idea of the variation from measurement to measurement. If we plot a histogram of the difference of every sequential body fat percentage measurement, we get this:
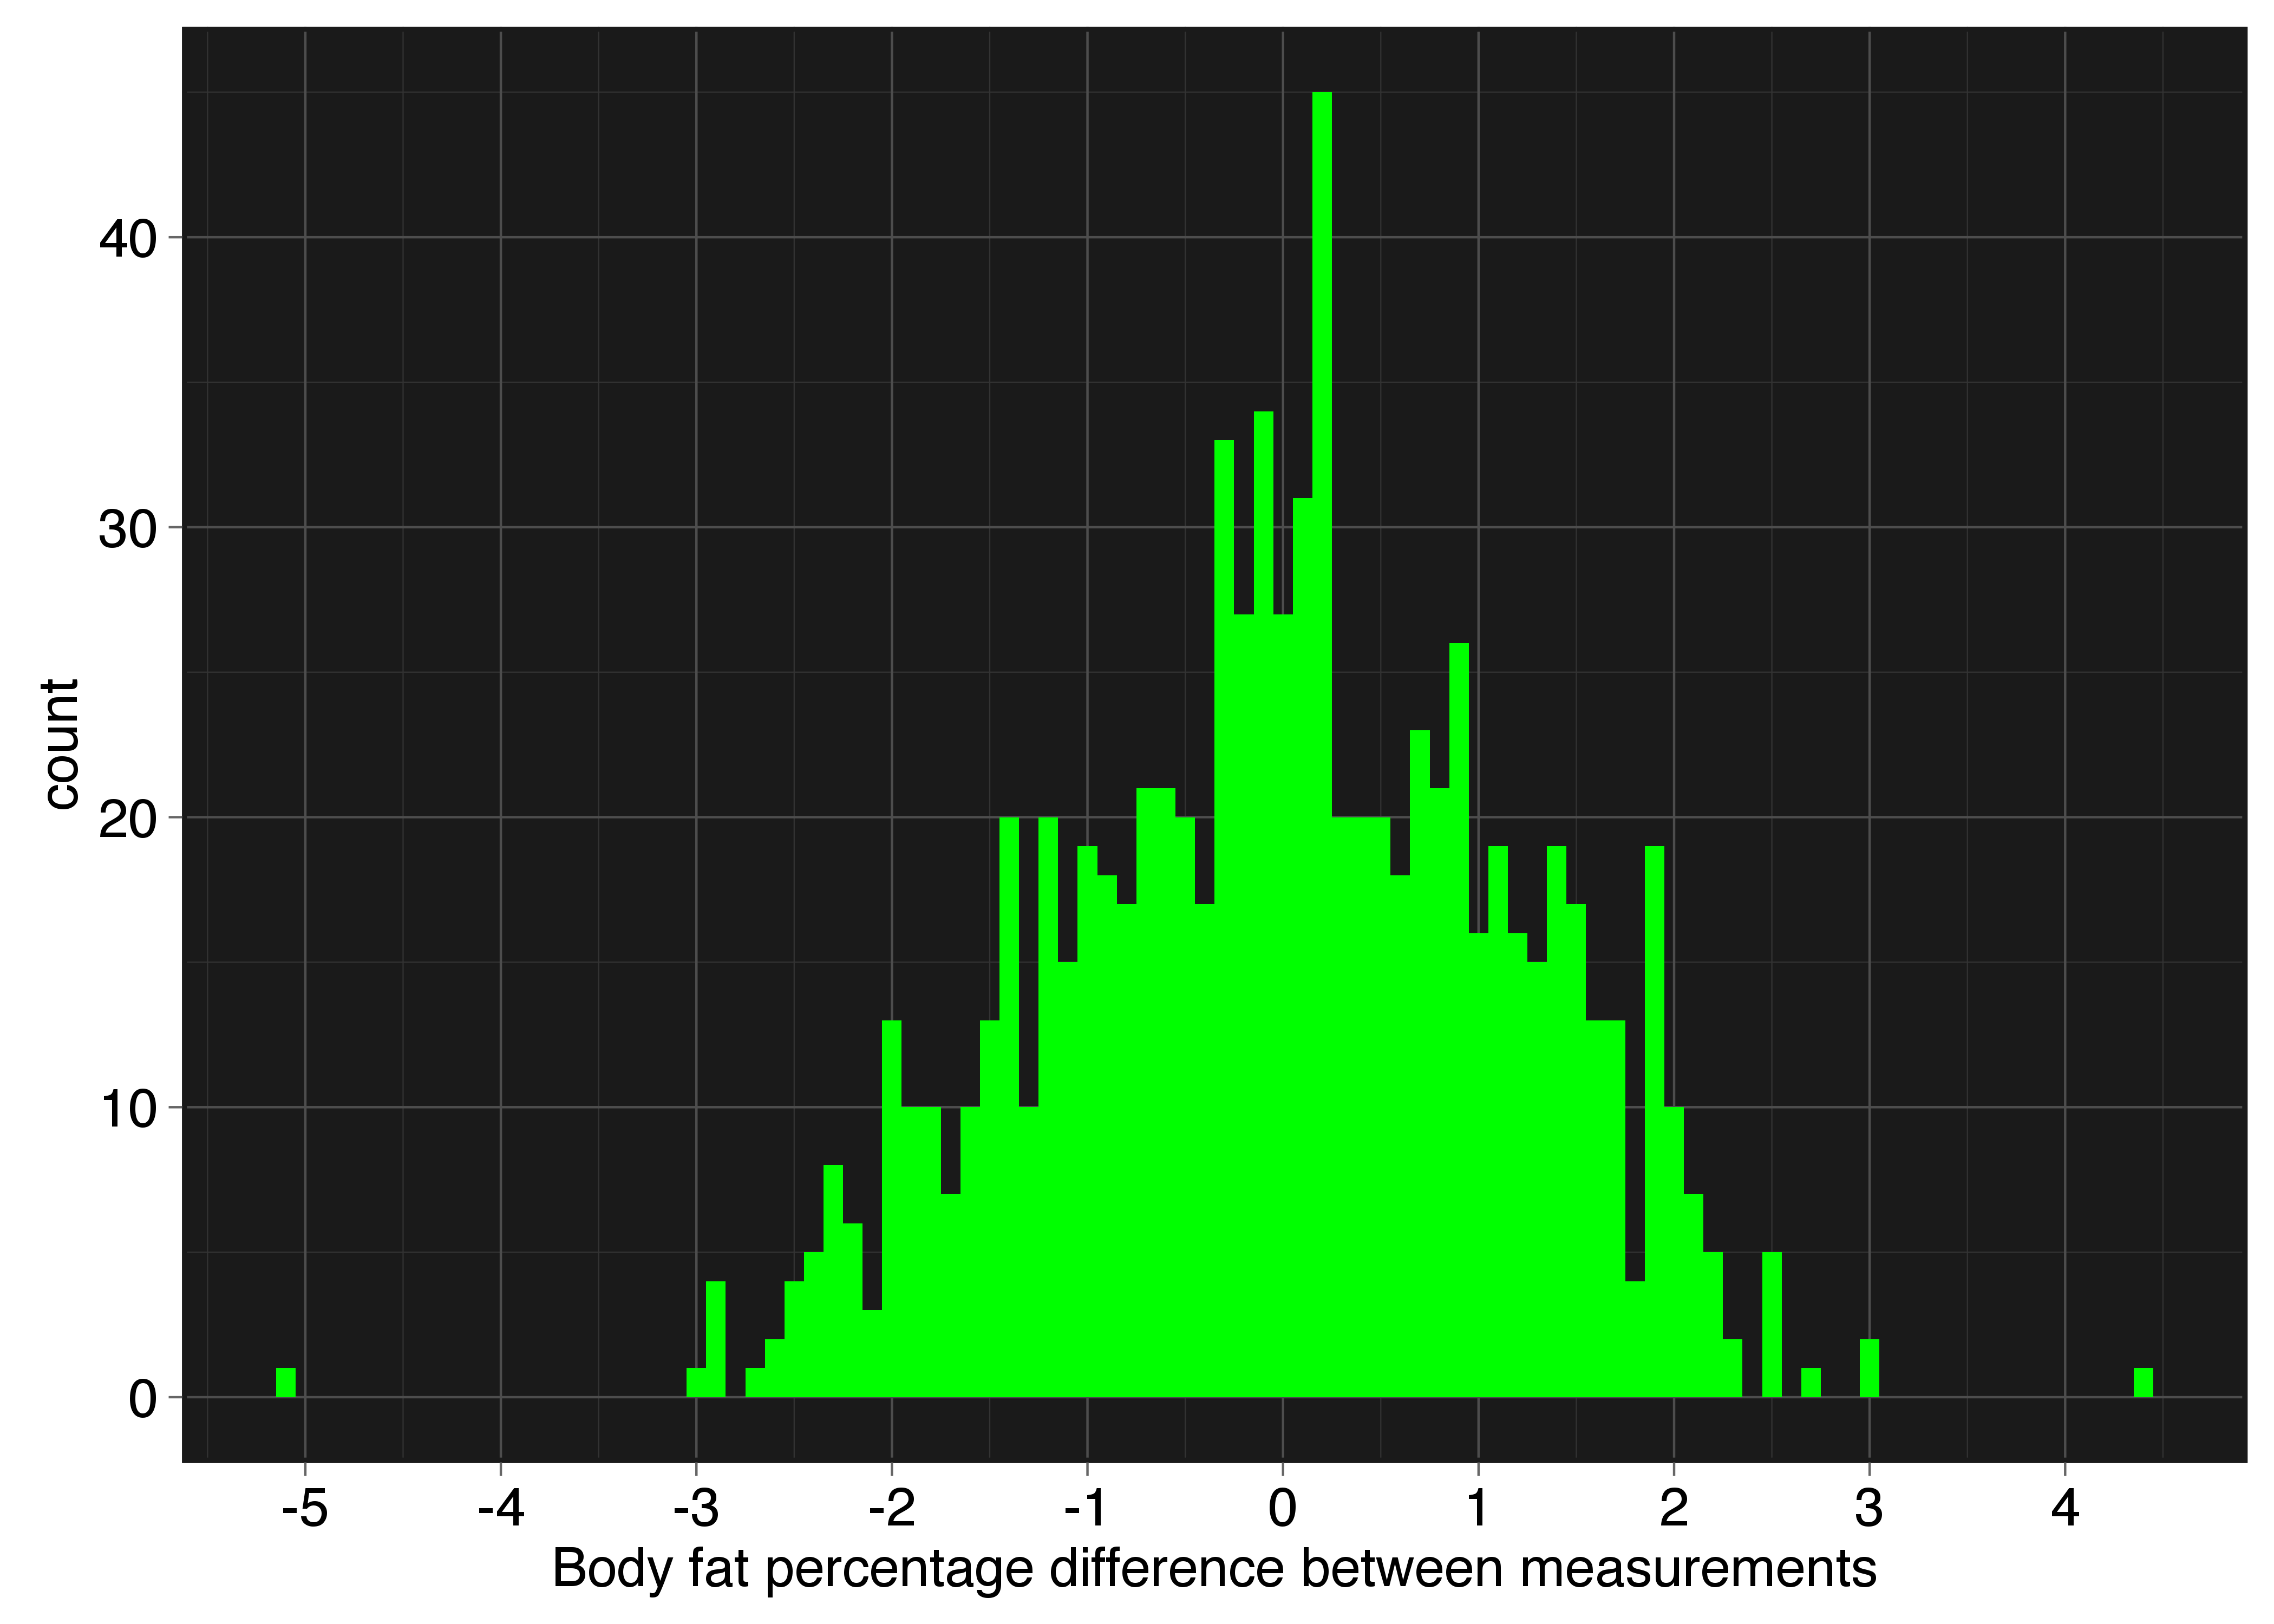
which shows that in general, we shouldn’t be surprised if there are differences of about ±2% between each measurement. You can also look at weight as a function of body fat, and see in general, the distribution has a width of about 2% points. With knowledge of the precision, how is the accuracy? Surprisingly decent, as I discovered when my skin fold measurement calipers came in the mail a few days ago. The scale is currently putting my body fat percentage around 18.5-19.5%, and the calipers gave me a reading of 19%. Definitely within the ballpark of each other. There are other methods such as DEXA scans, hydrostatic weighing, and air displacement plethysmography that give arguably more accurate numbers. But nothing is as powerful as a measurement you can do on your own, in your home, on a day-to-day basis.
CUTTING AND BULKING: Bodybuilding nonsense or effective tool?
Now that we know how well we can trust these scale’s more advanced features, we can investigate how one would use them to gauge their goals other than weight loss. The main goal in bodybuilding is to gain as much muscle as possible while limiting fat gain. However, it’s difficult to gain muscle while on a caloric deficit while trying to lose fat, and easy to pack on fat at a caloric surplus where it’s easier to gain muscle. One of the most common ways to approach this problem is to break up the process into two periods: a “bulk” where you eat enough to gain muscle, followed by a “cut” where you eat fewer calories than you burn and lose weight. The major assumption behind this cycle is that in a bulking period, you gain muscle at a higher rate than you lose it in the cutting period. Thus, over a few of these cycles, you increase your base lean mass while minimizing fat. An ideal cycle would be where you gained 100% muscle for every pound gained in your bulk, and lost no muscle in every cut. I simulated what an unrealistic “ideal” cycle like that would look like for a person dropping from 30% bodyfat to 5% bodyfat over a couple years in the following video (the cutting periods are marked in red and the bulking periods in green):
As you can see, an ideal cutting period has an average slope of zero on the lean weight vs weight axis, and the ideal cutting period a slope of zero. By extracting these slopes from your lean weight vs weight graph, you can calculate the “efficiency” of your muscle gaining cycle. As long as the rate of muscle gain during the bulk is higher than the rate of muscle loss in the cut, the cycle can result in a net gain of muscle. Gain too much fat in the bulk (often referred to as a “dirty bulk”) requires a more efficient cut to reach your desired body composition.
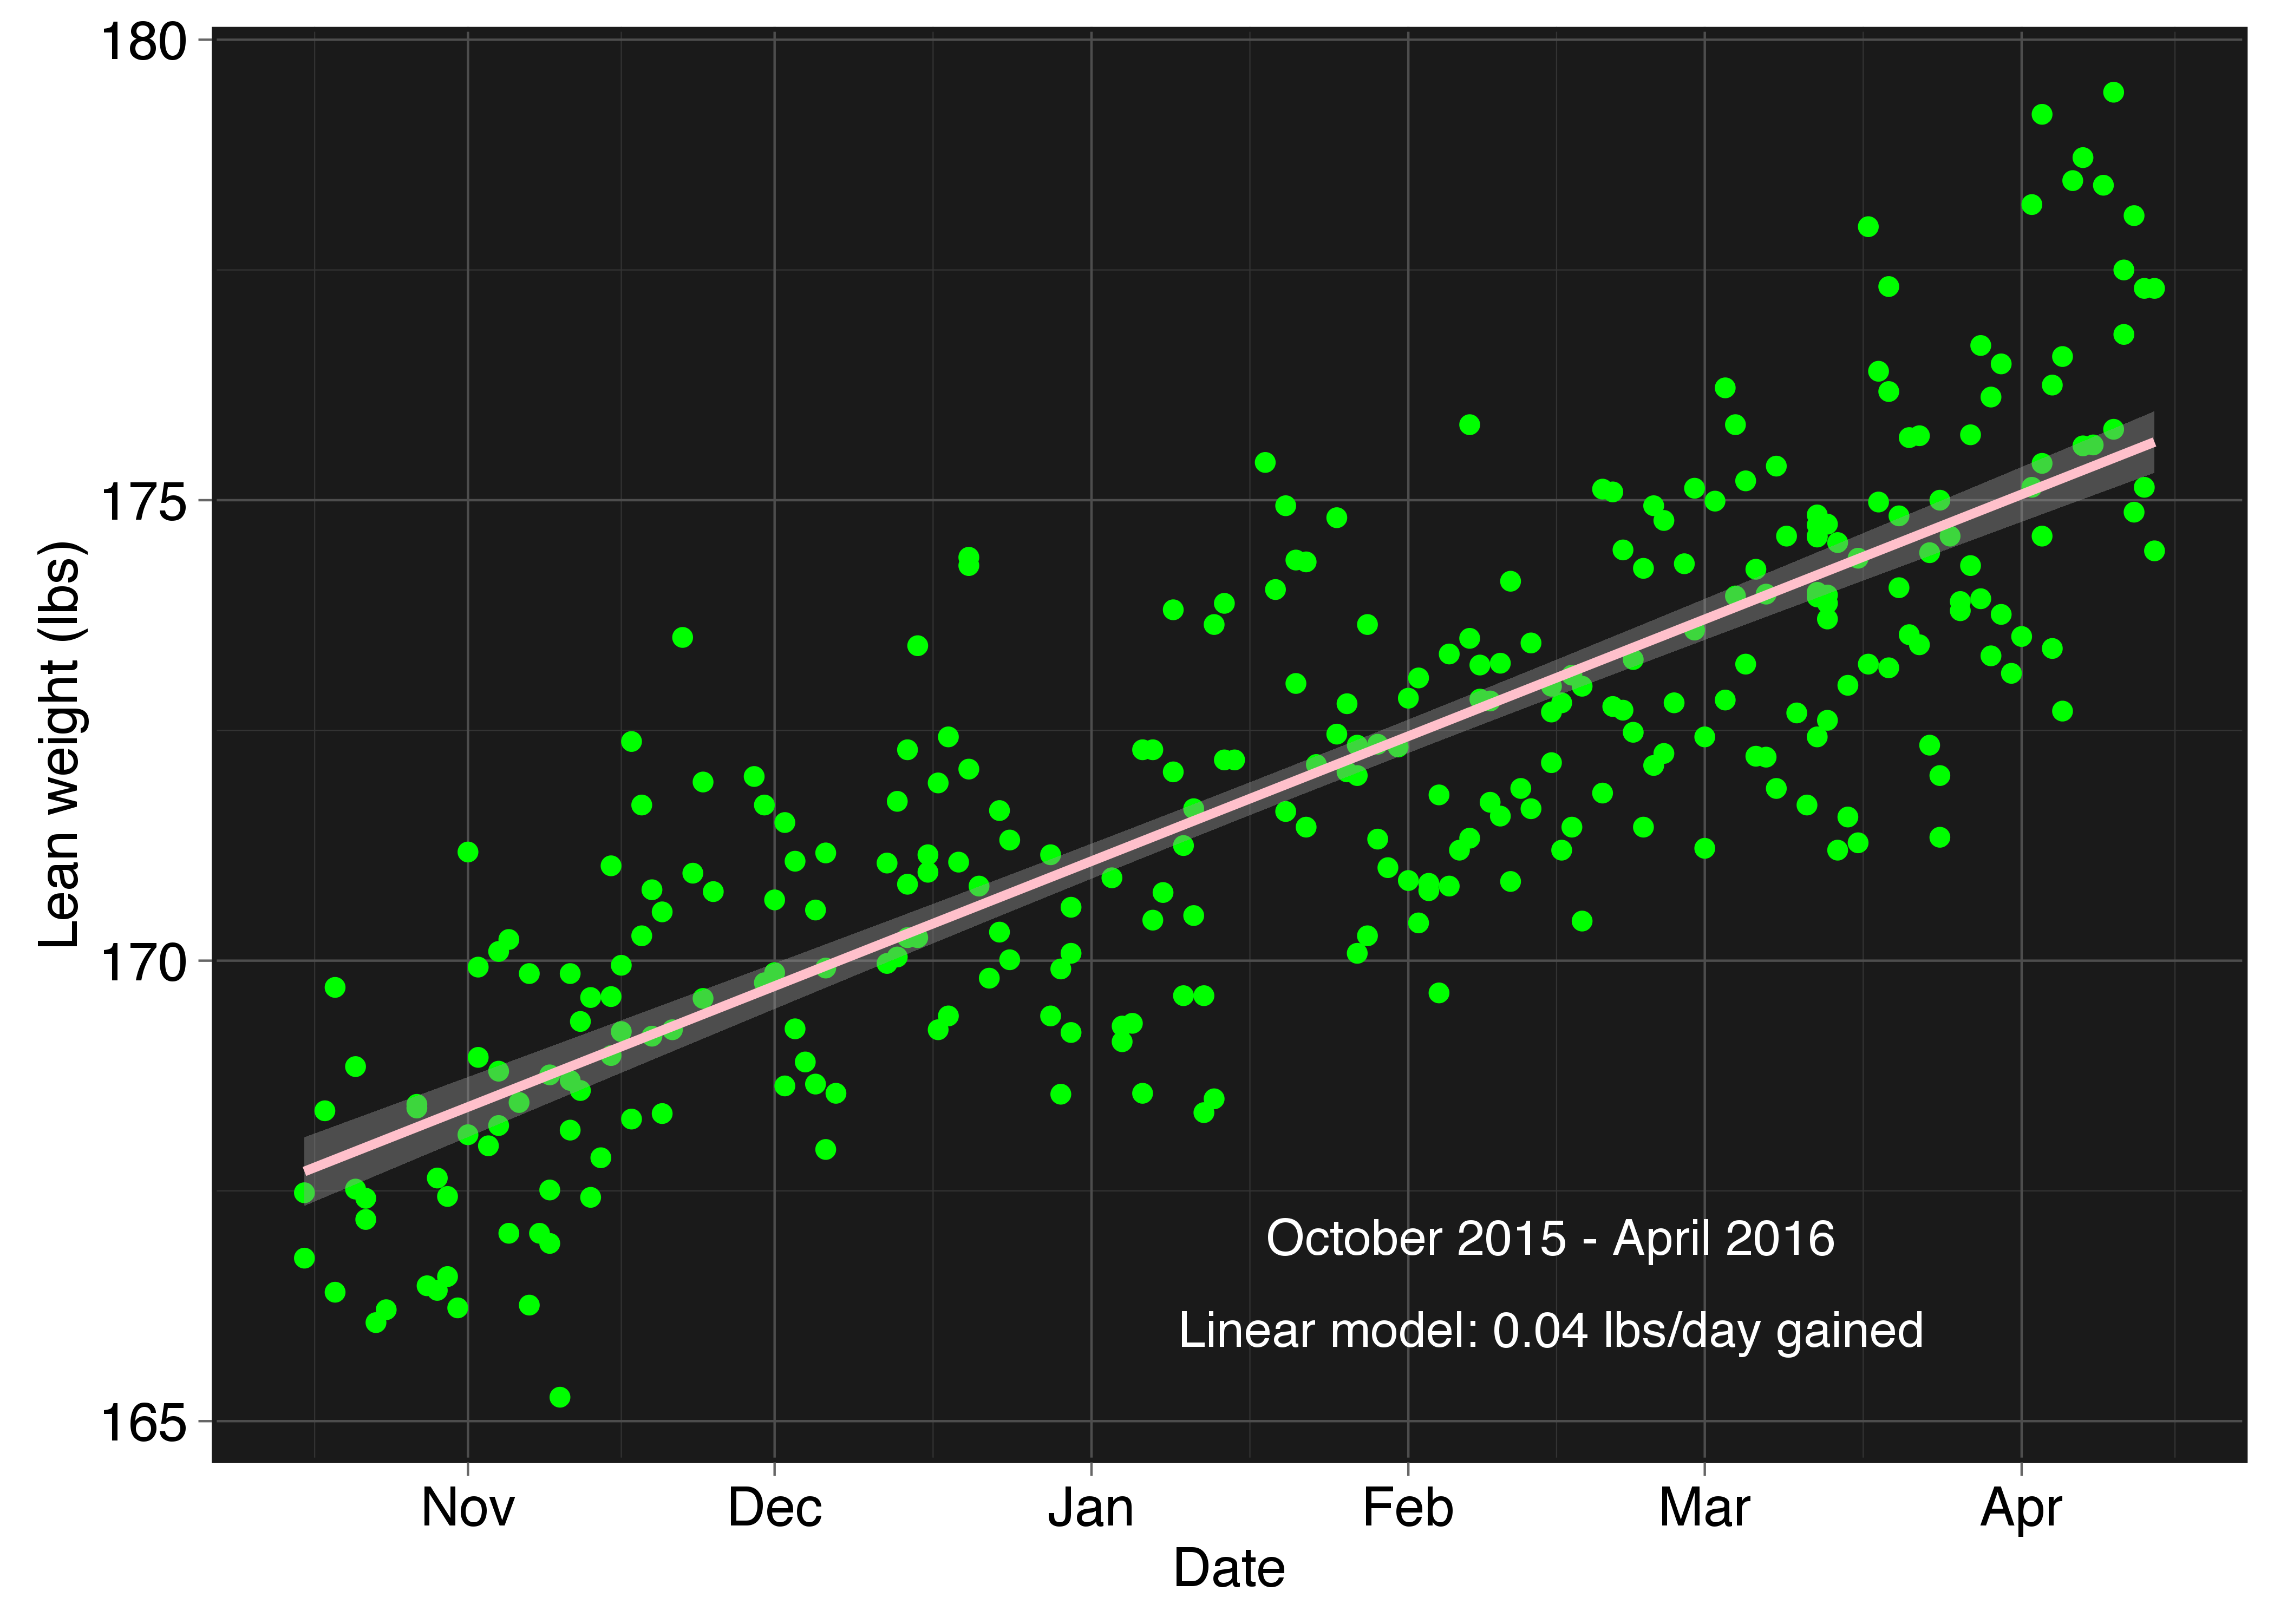
Here is the period from October 2015 through April 2016 during my “slow bulk.” Here I fit a linear model to the weight vs time graph to calculate how fast I was gaining weight during this period.
And here is the rate while losing weight:
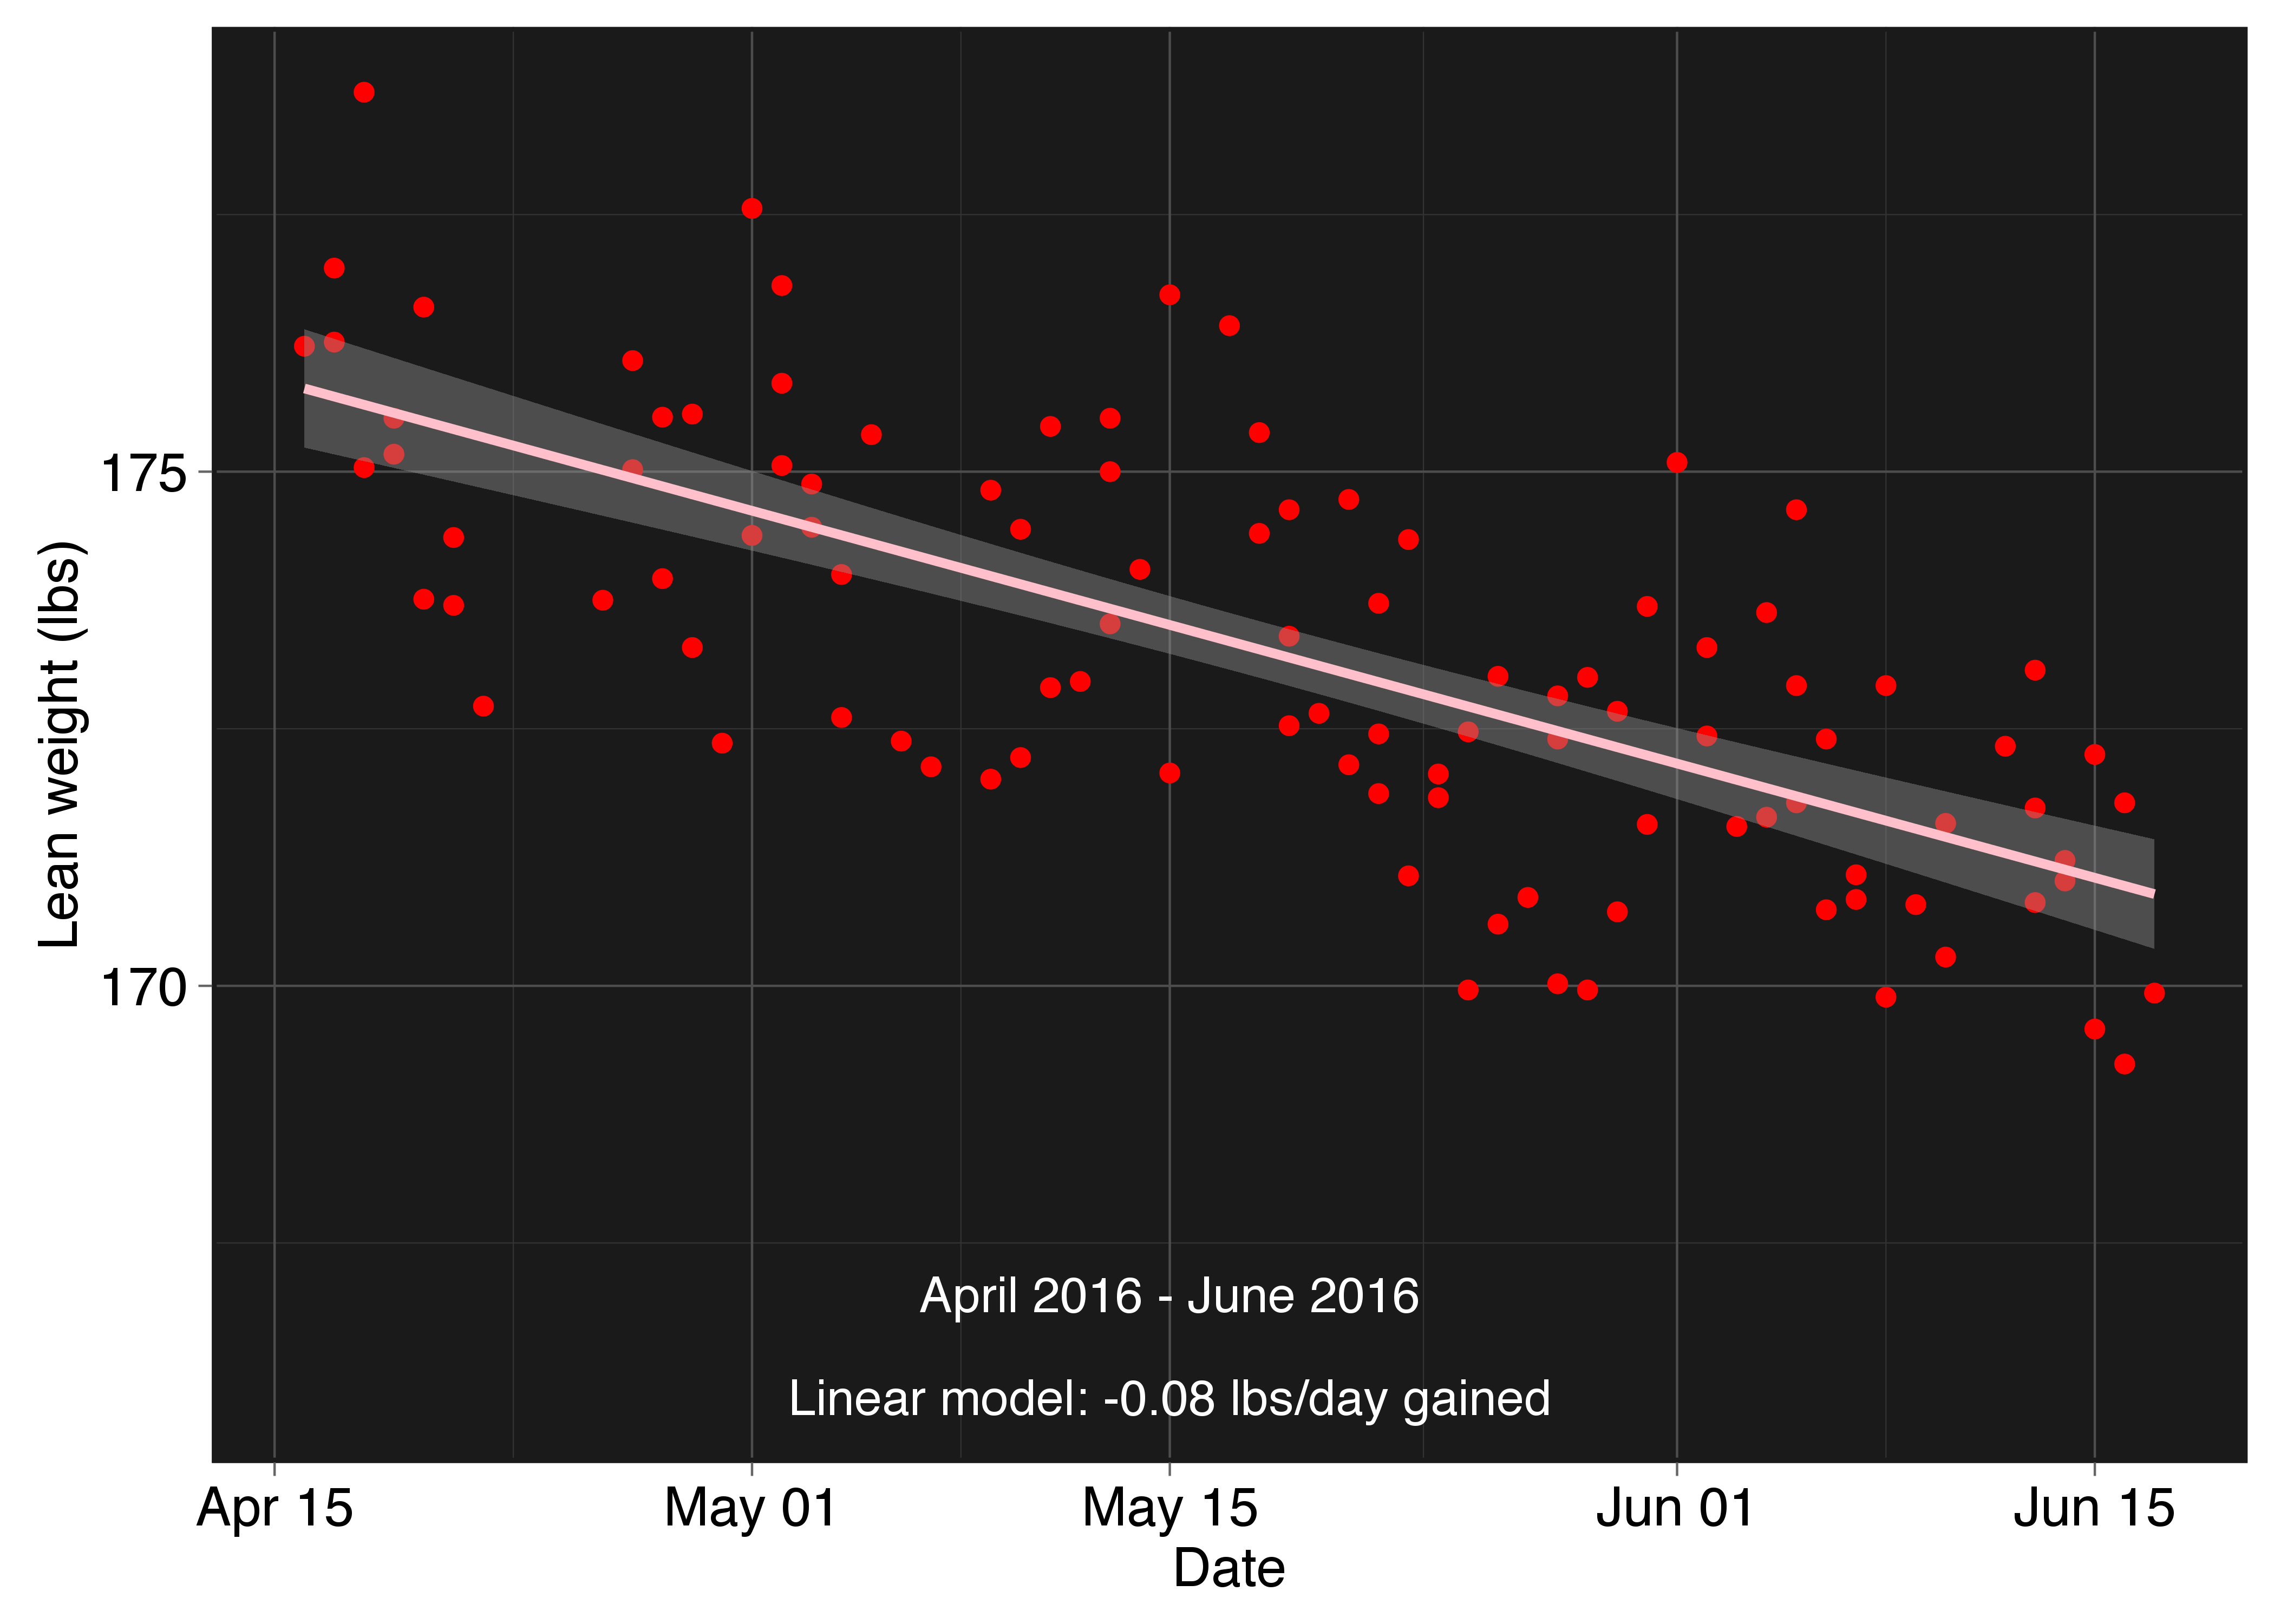
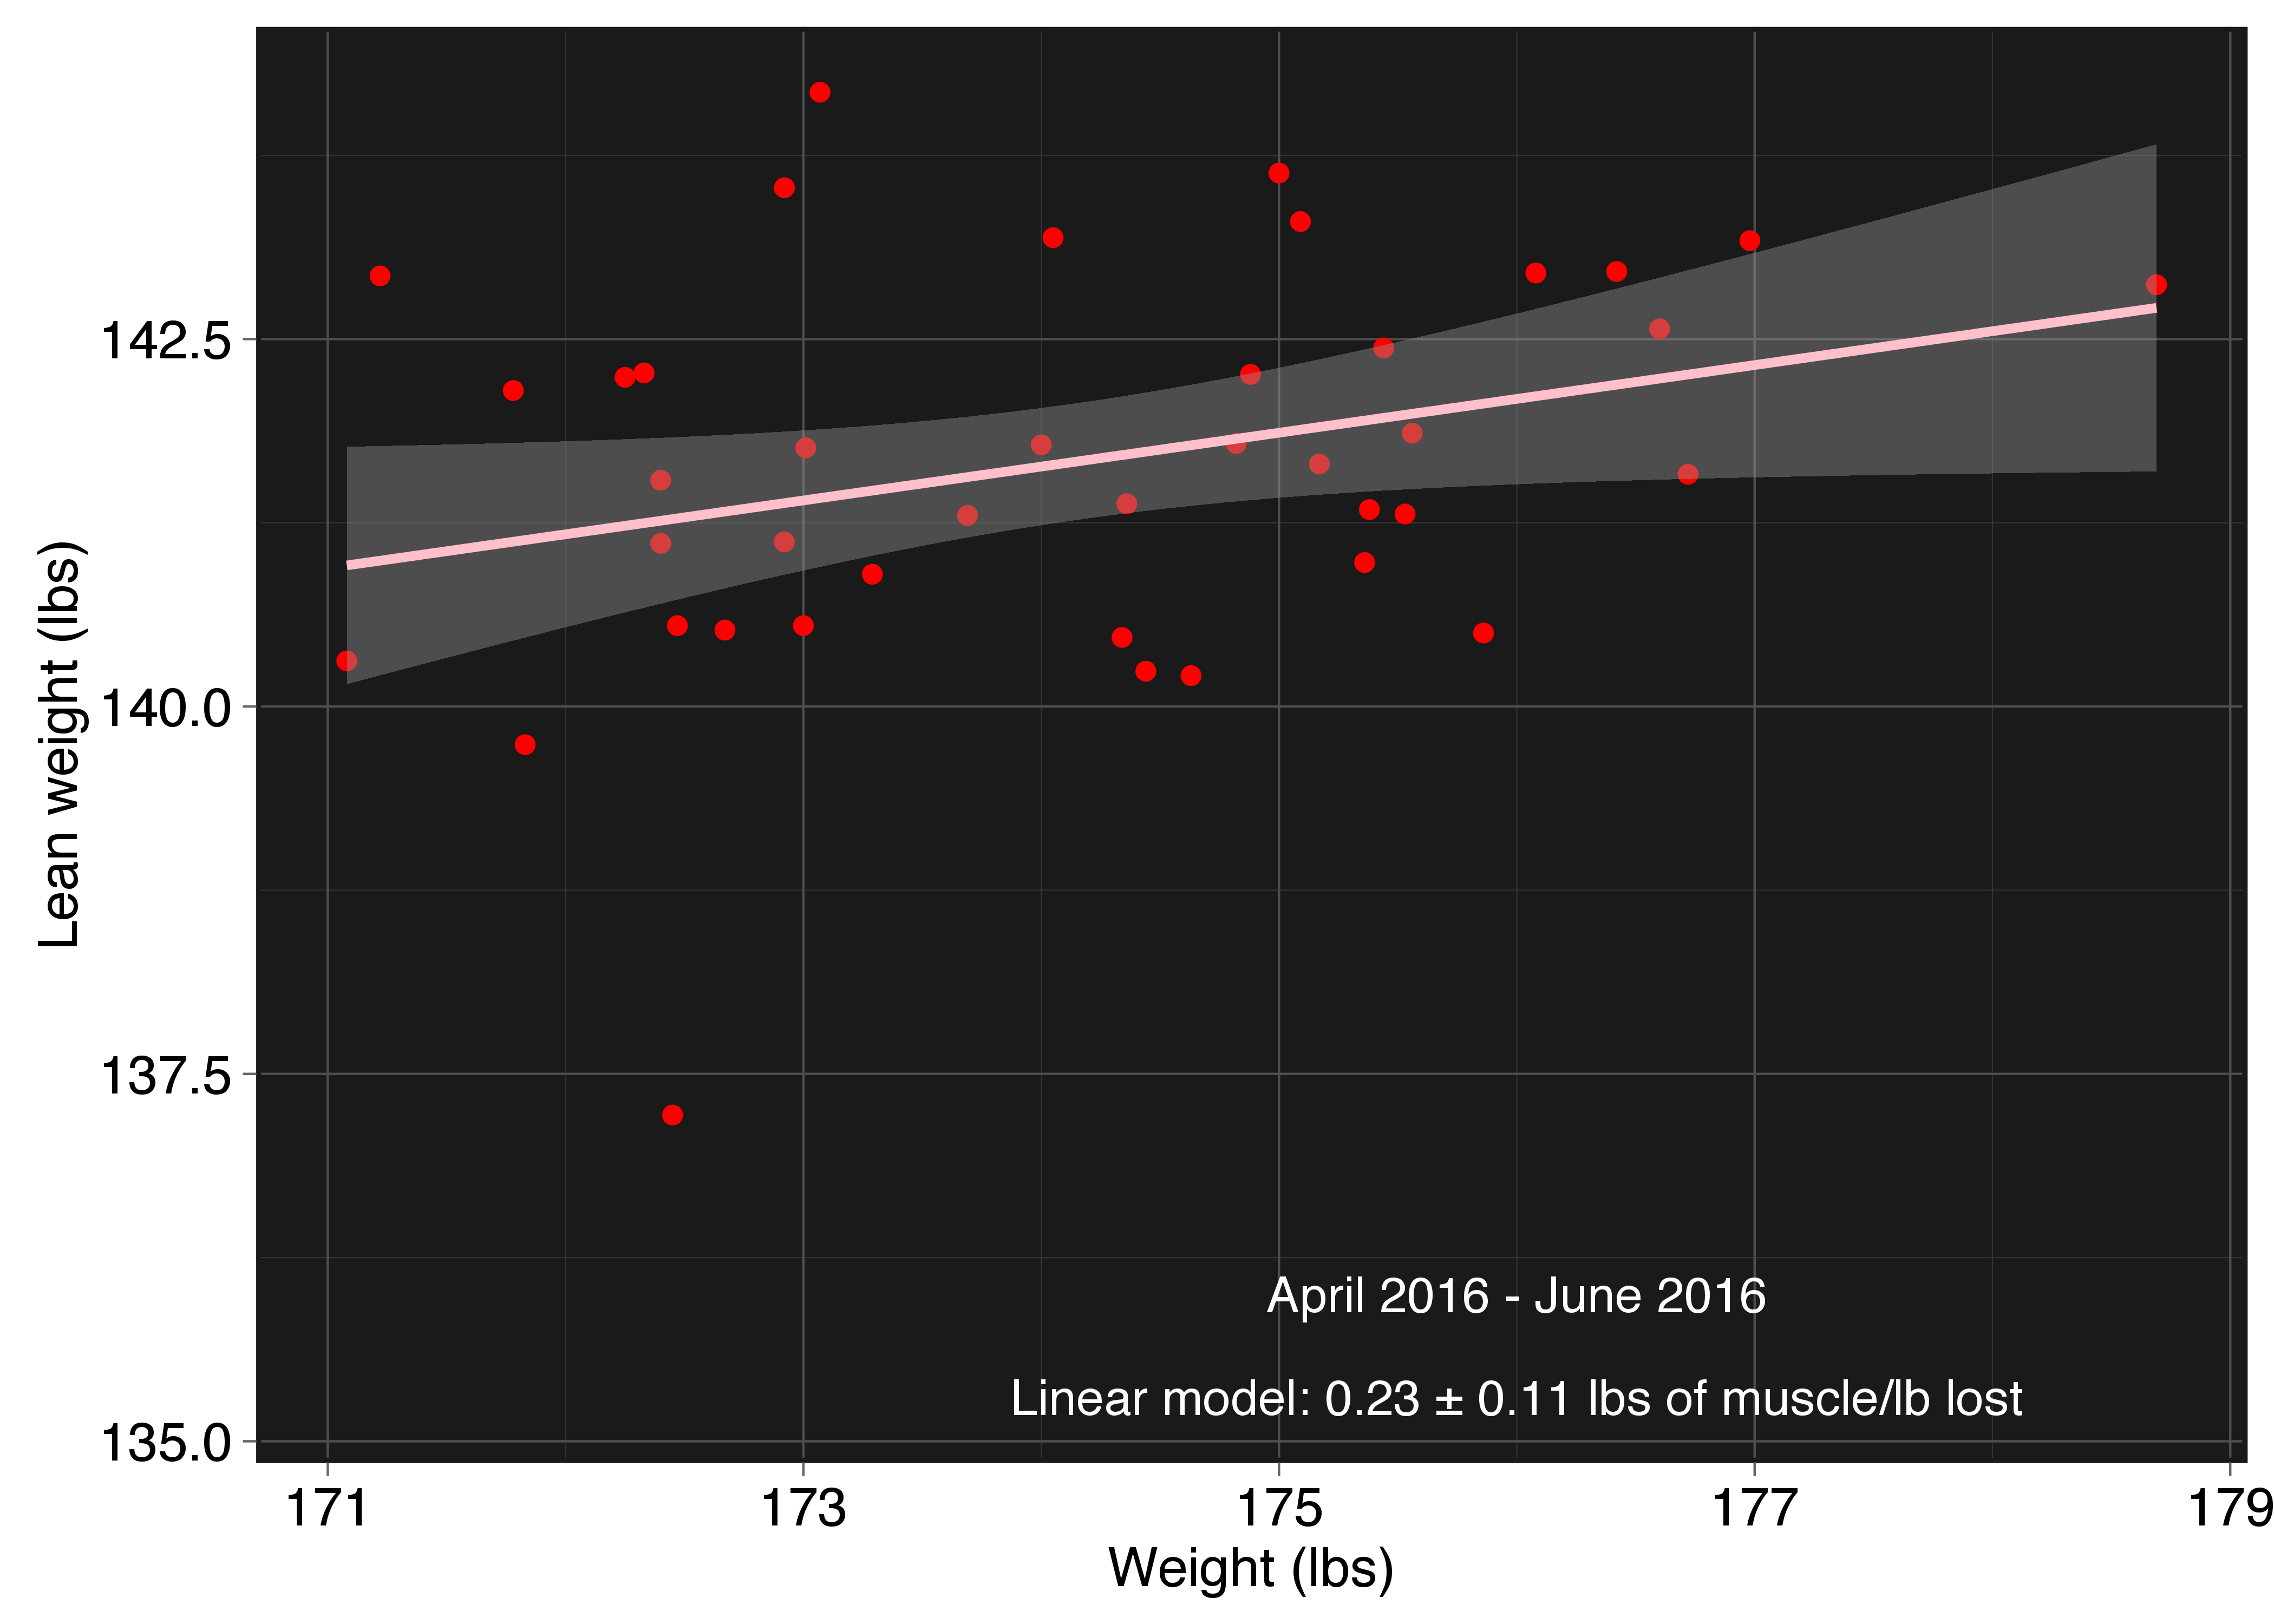
It seems I’m losing weight at twice the rate I gained: 0.08 lbs/day lost vs 0.04/day gained. At first, when I saw this, I was pretty ecstatic. However, I can also use this data to investigate the proportion of muscle gained vs fat gained during these two periods. Here, I fit a linear model to the data to extract approximately how many pounds of muscle I gained for every pound of body weight.
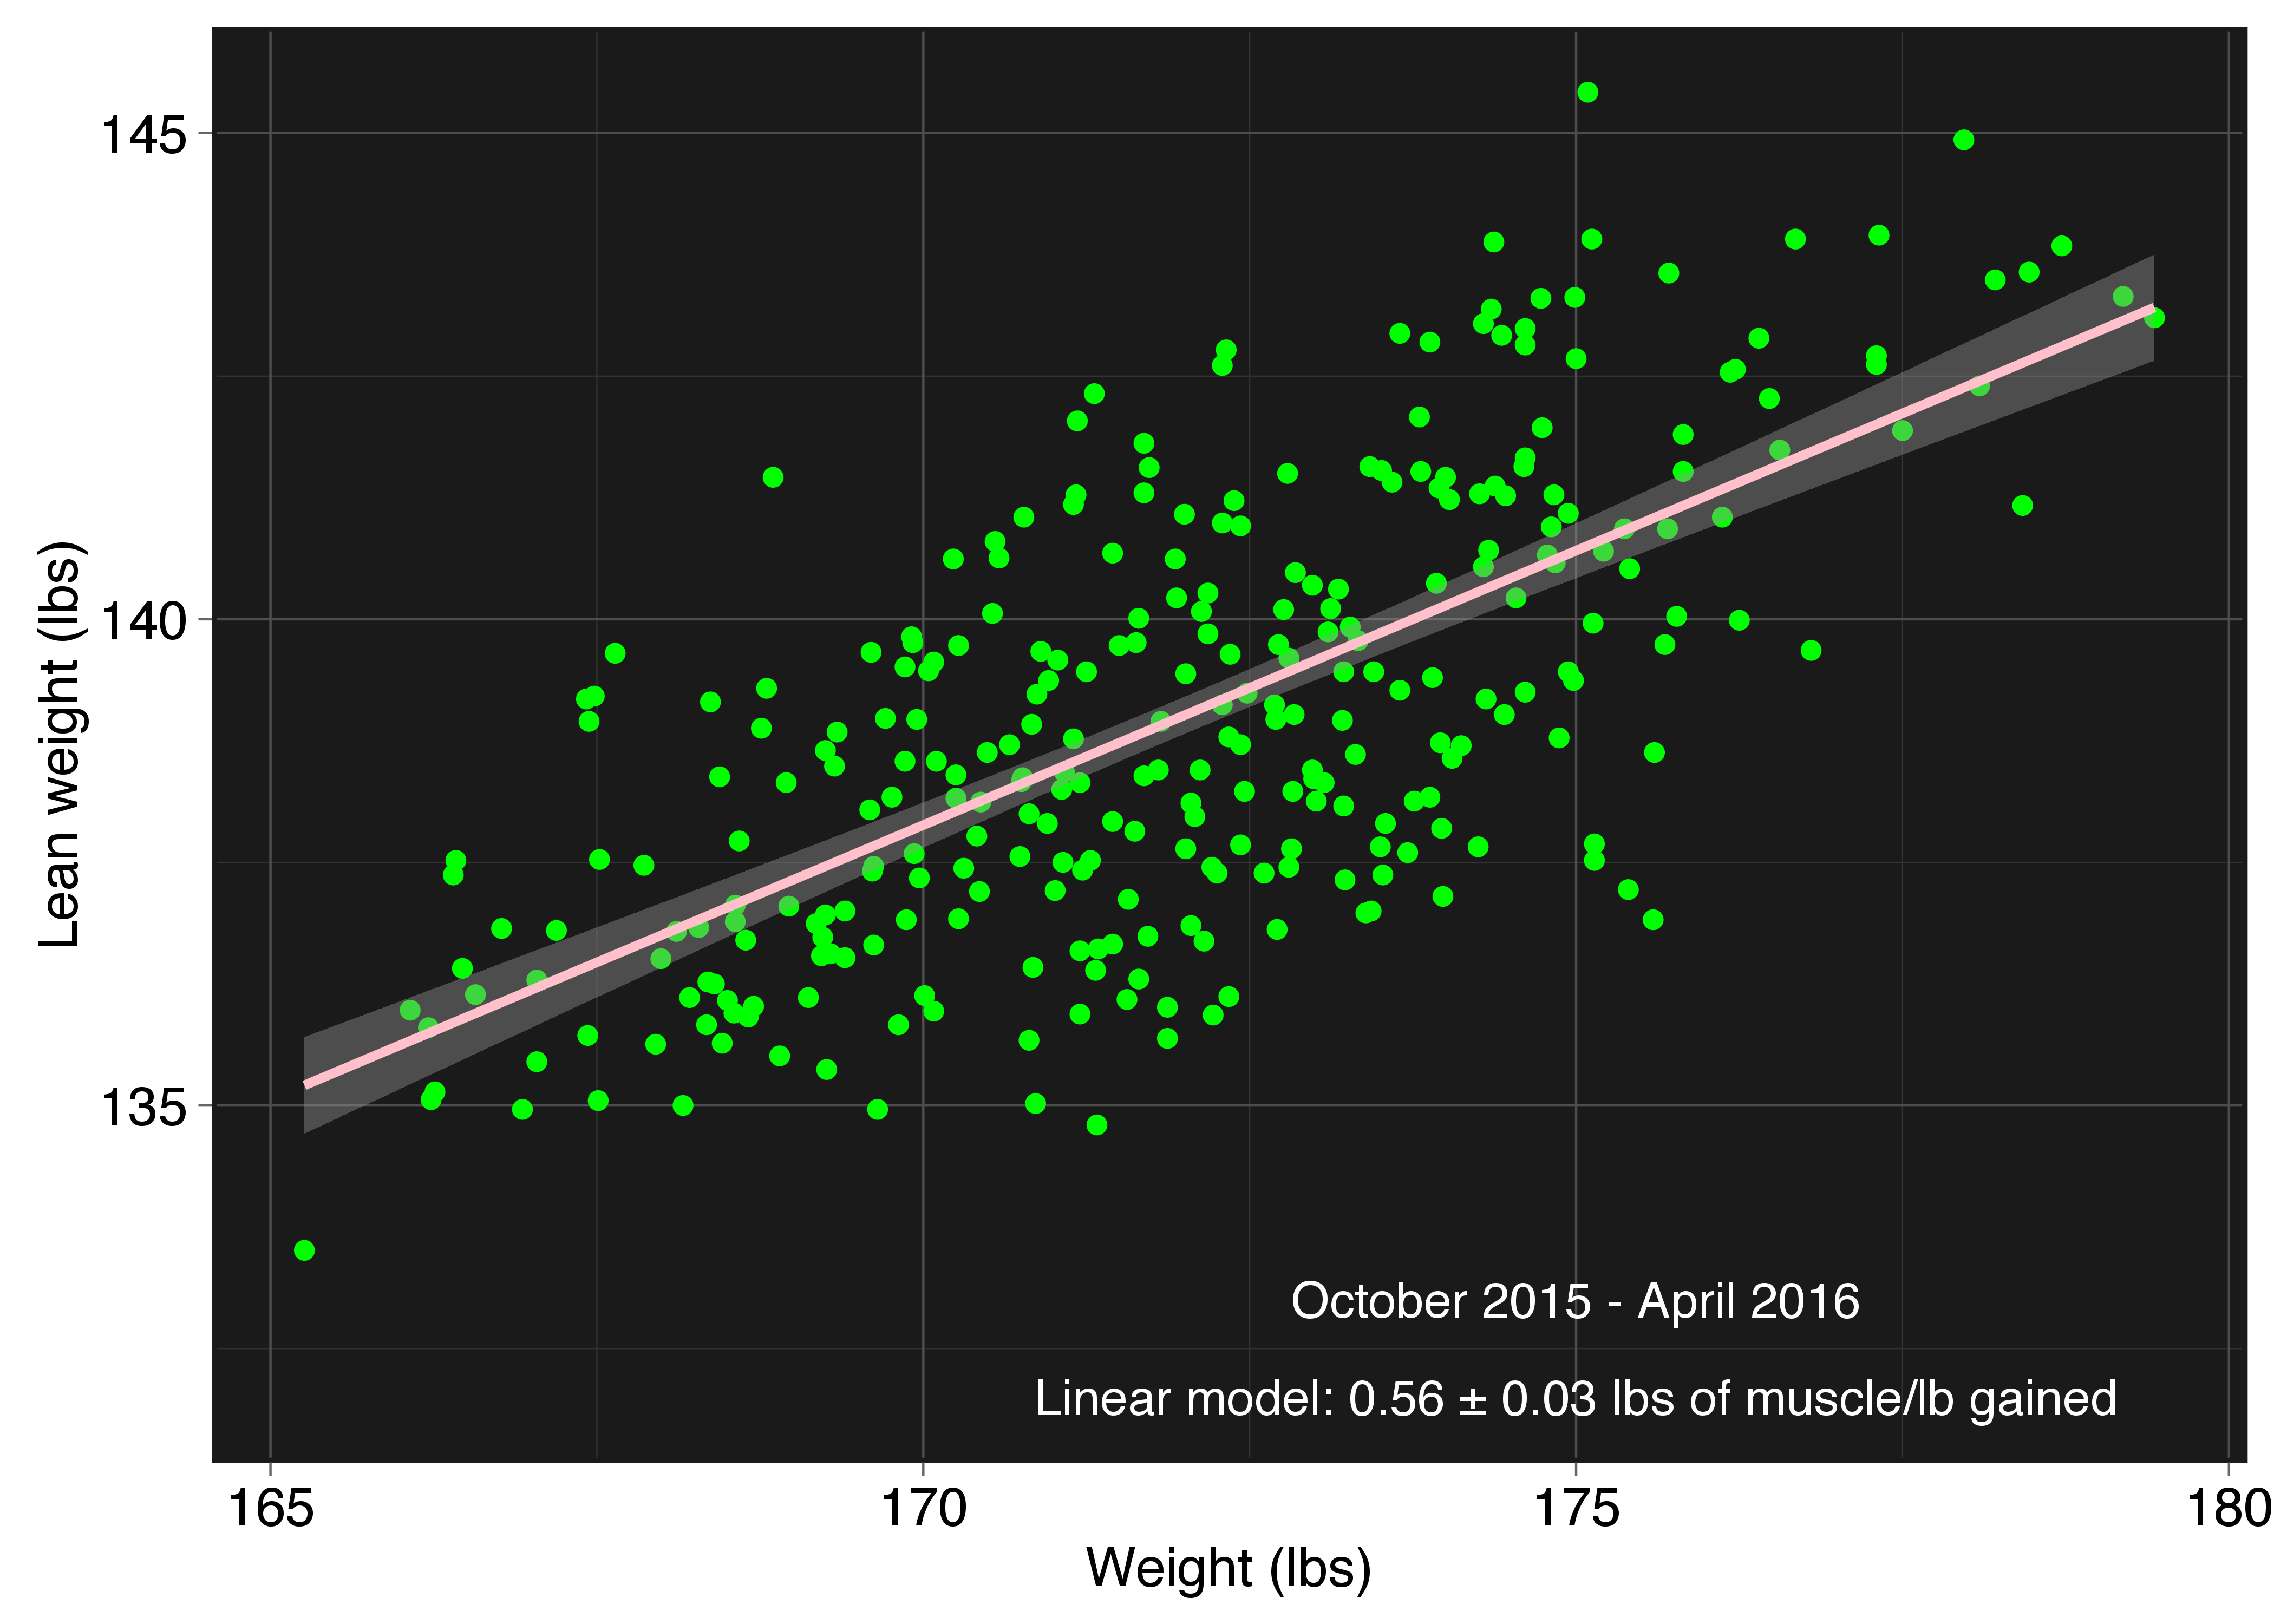
Note the change of axis: The x-axis is my total weight, and the y-axis is my lean body mass. Ideally, this would be a 45 degree line in the bulking phase (100% muscle for every pound of body weight gained) and horizontal in the cutting phase (no lean body mass lost as weight decreases). In reality, in seems most anecdotal evidence online says a 1:1 ratio is more realistic. The above data thus said I gained at a ratio of 0.56/(1-0.56) = 1.27 lbs of muscle to every pound of fat for the bulking period, which is actually a pretty good ratio for building muscle naturally. However, looking at the data since I started cutting:
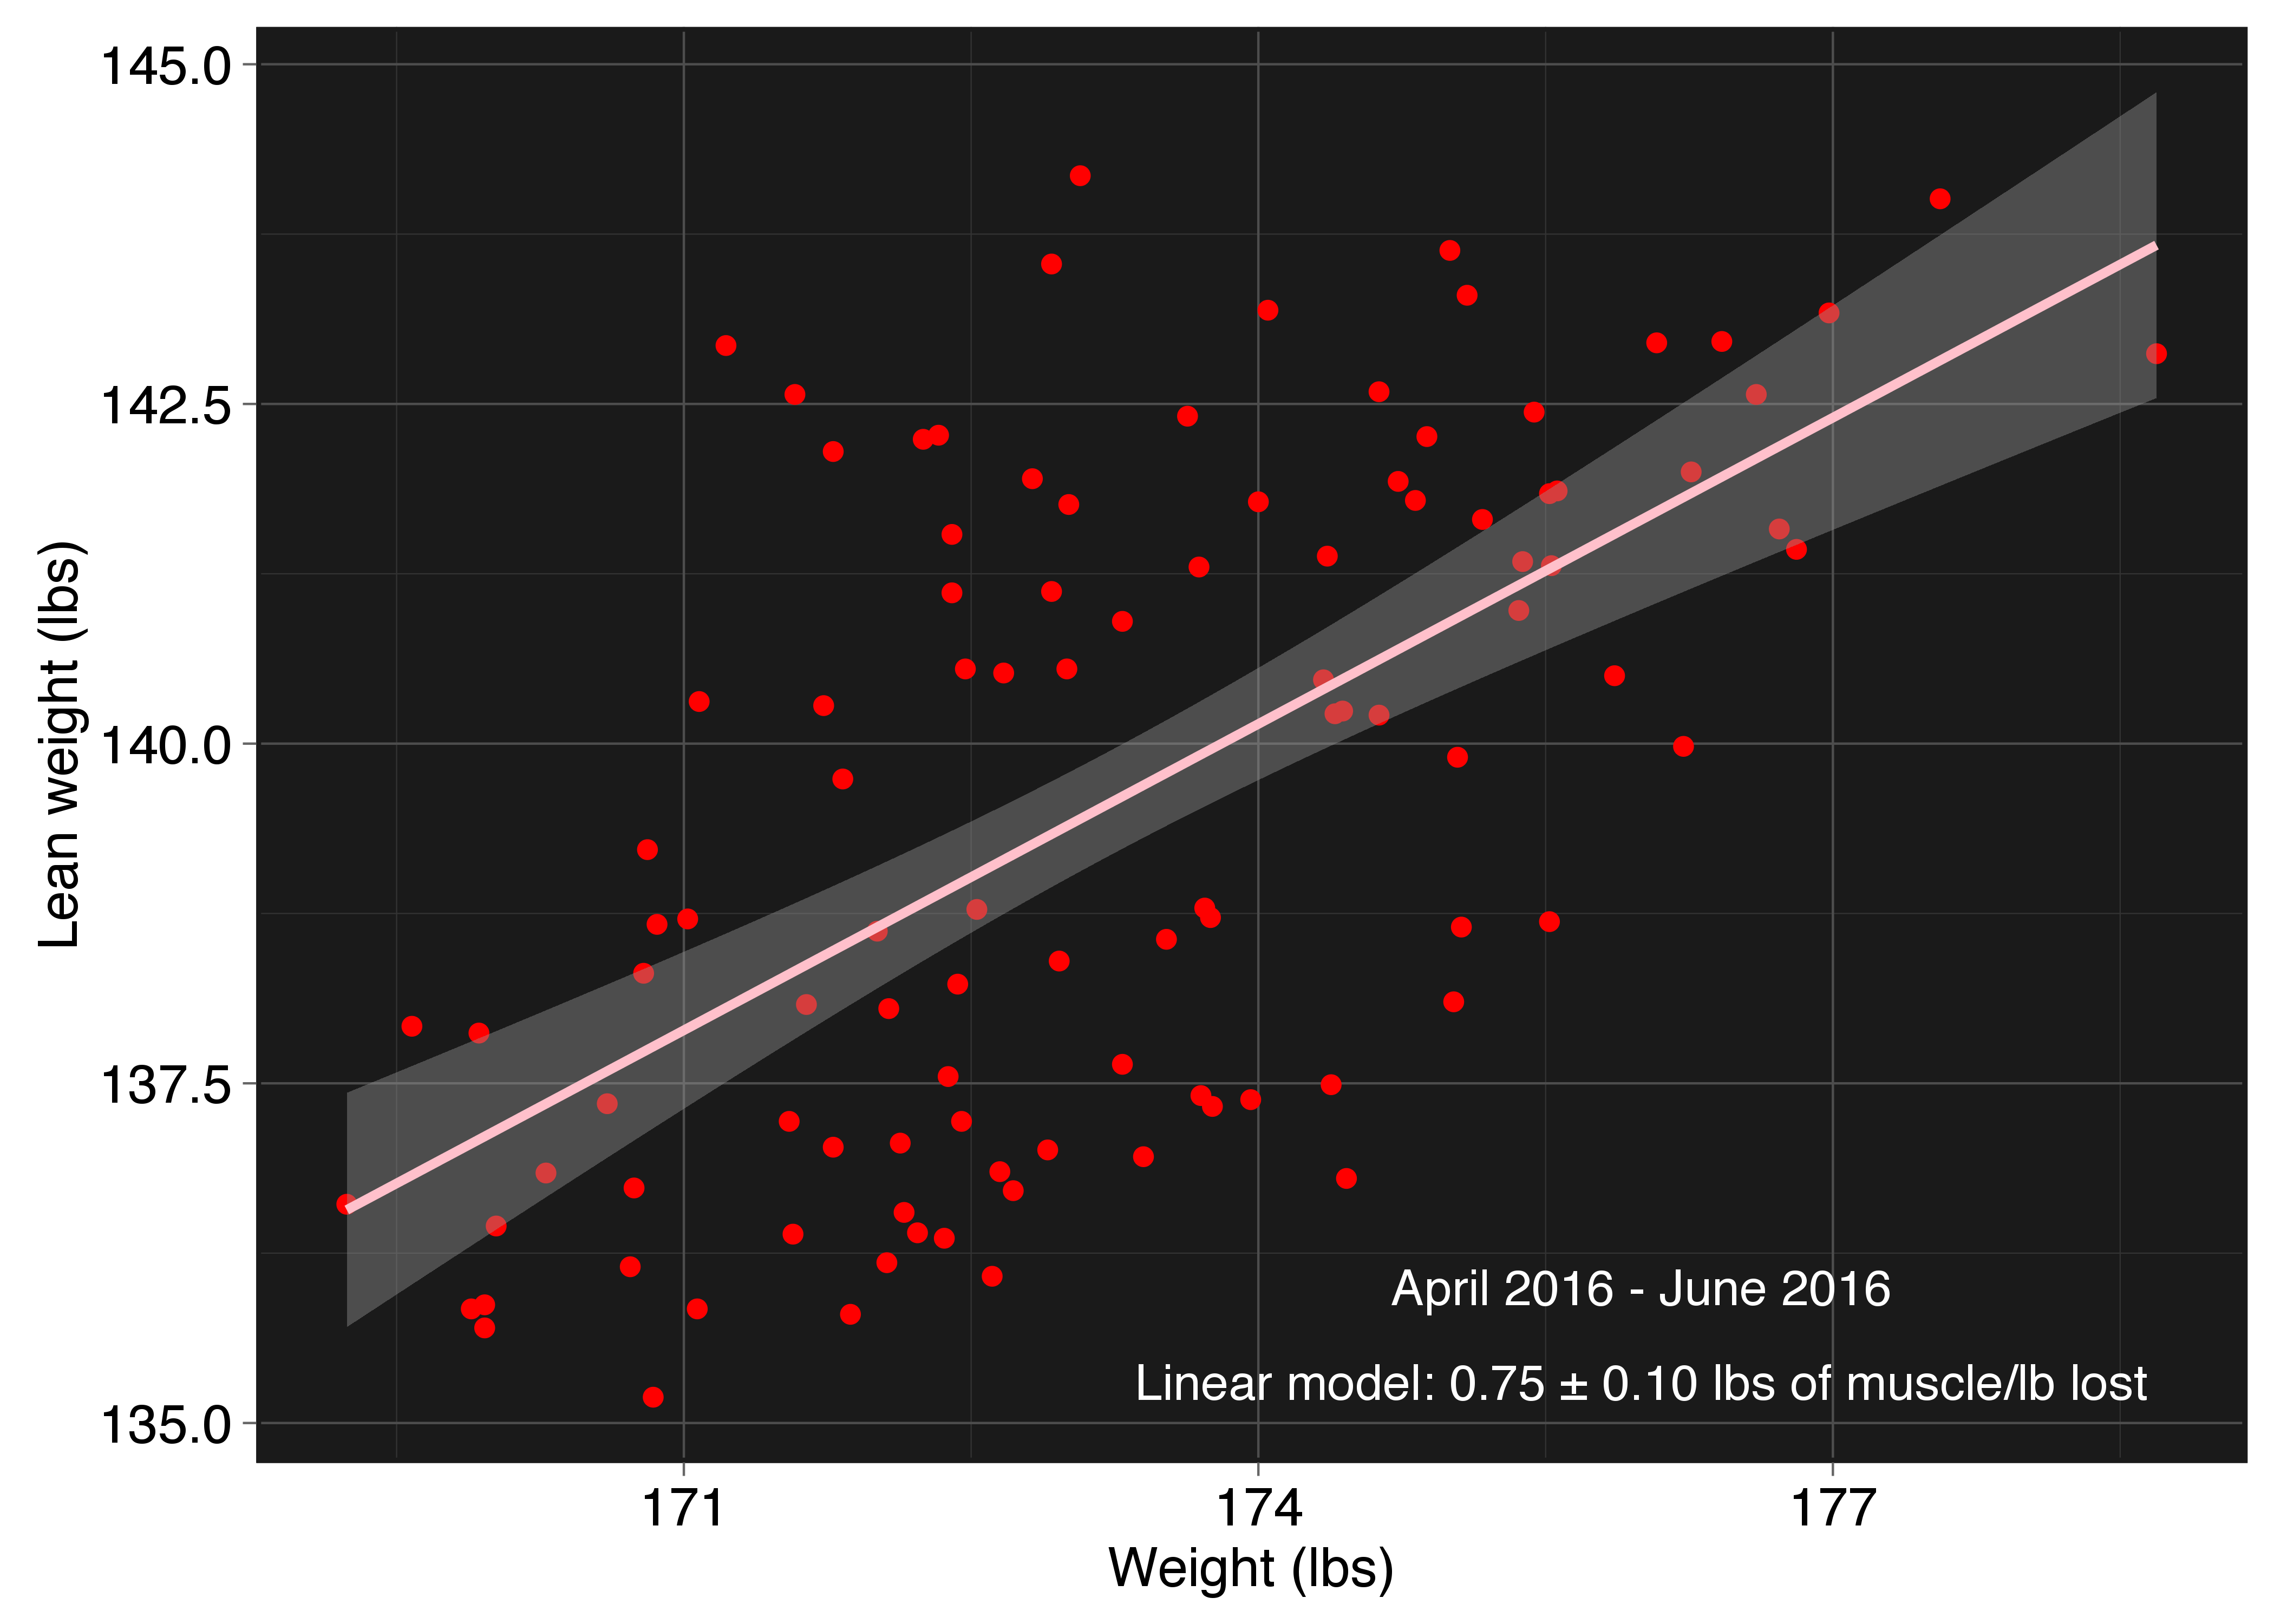
Bad news. This tells me at the current rate I’m losing weight, I’m actually losing muscle at a much higher rate than I’m losing fat: 3 lbs of muscle lost for every 1 lb of fat. I stared at this for a while and was blown away: How could I be doing this so wrong? I was especially flabbergasted because when I tracked myself in the mirror it seemed like I was losing more fat than muscle, but the data said otherwise. And then it hit me: I just did a whole analysis on when the scale is most accurate, and maybe I should tailor this analysis to only include the night time (presumably fully hydrated) data points I just told you were best for reading body fat. Doing that for the bulking period got me this:
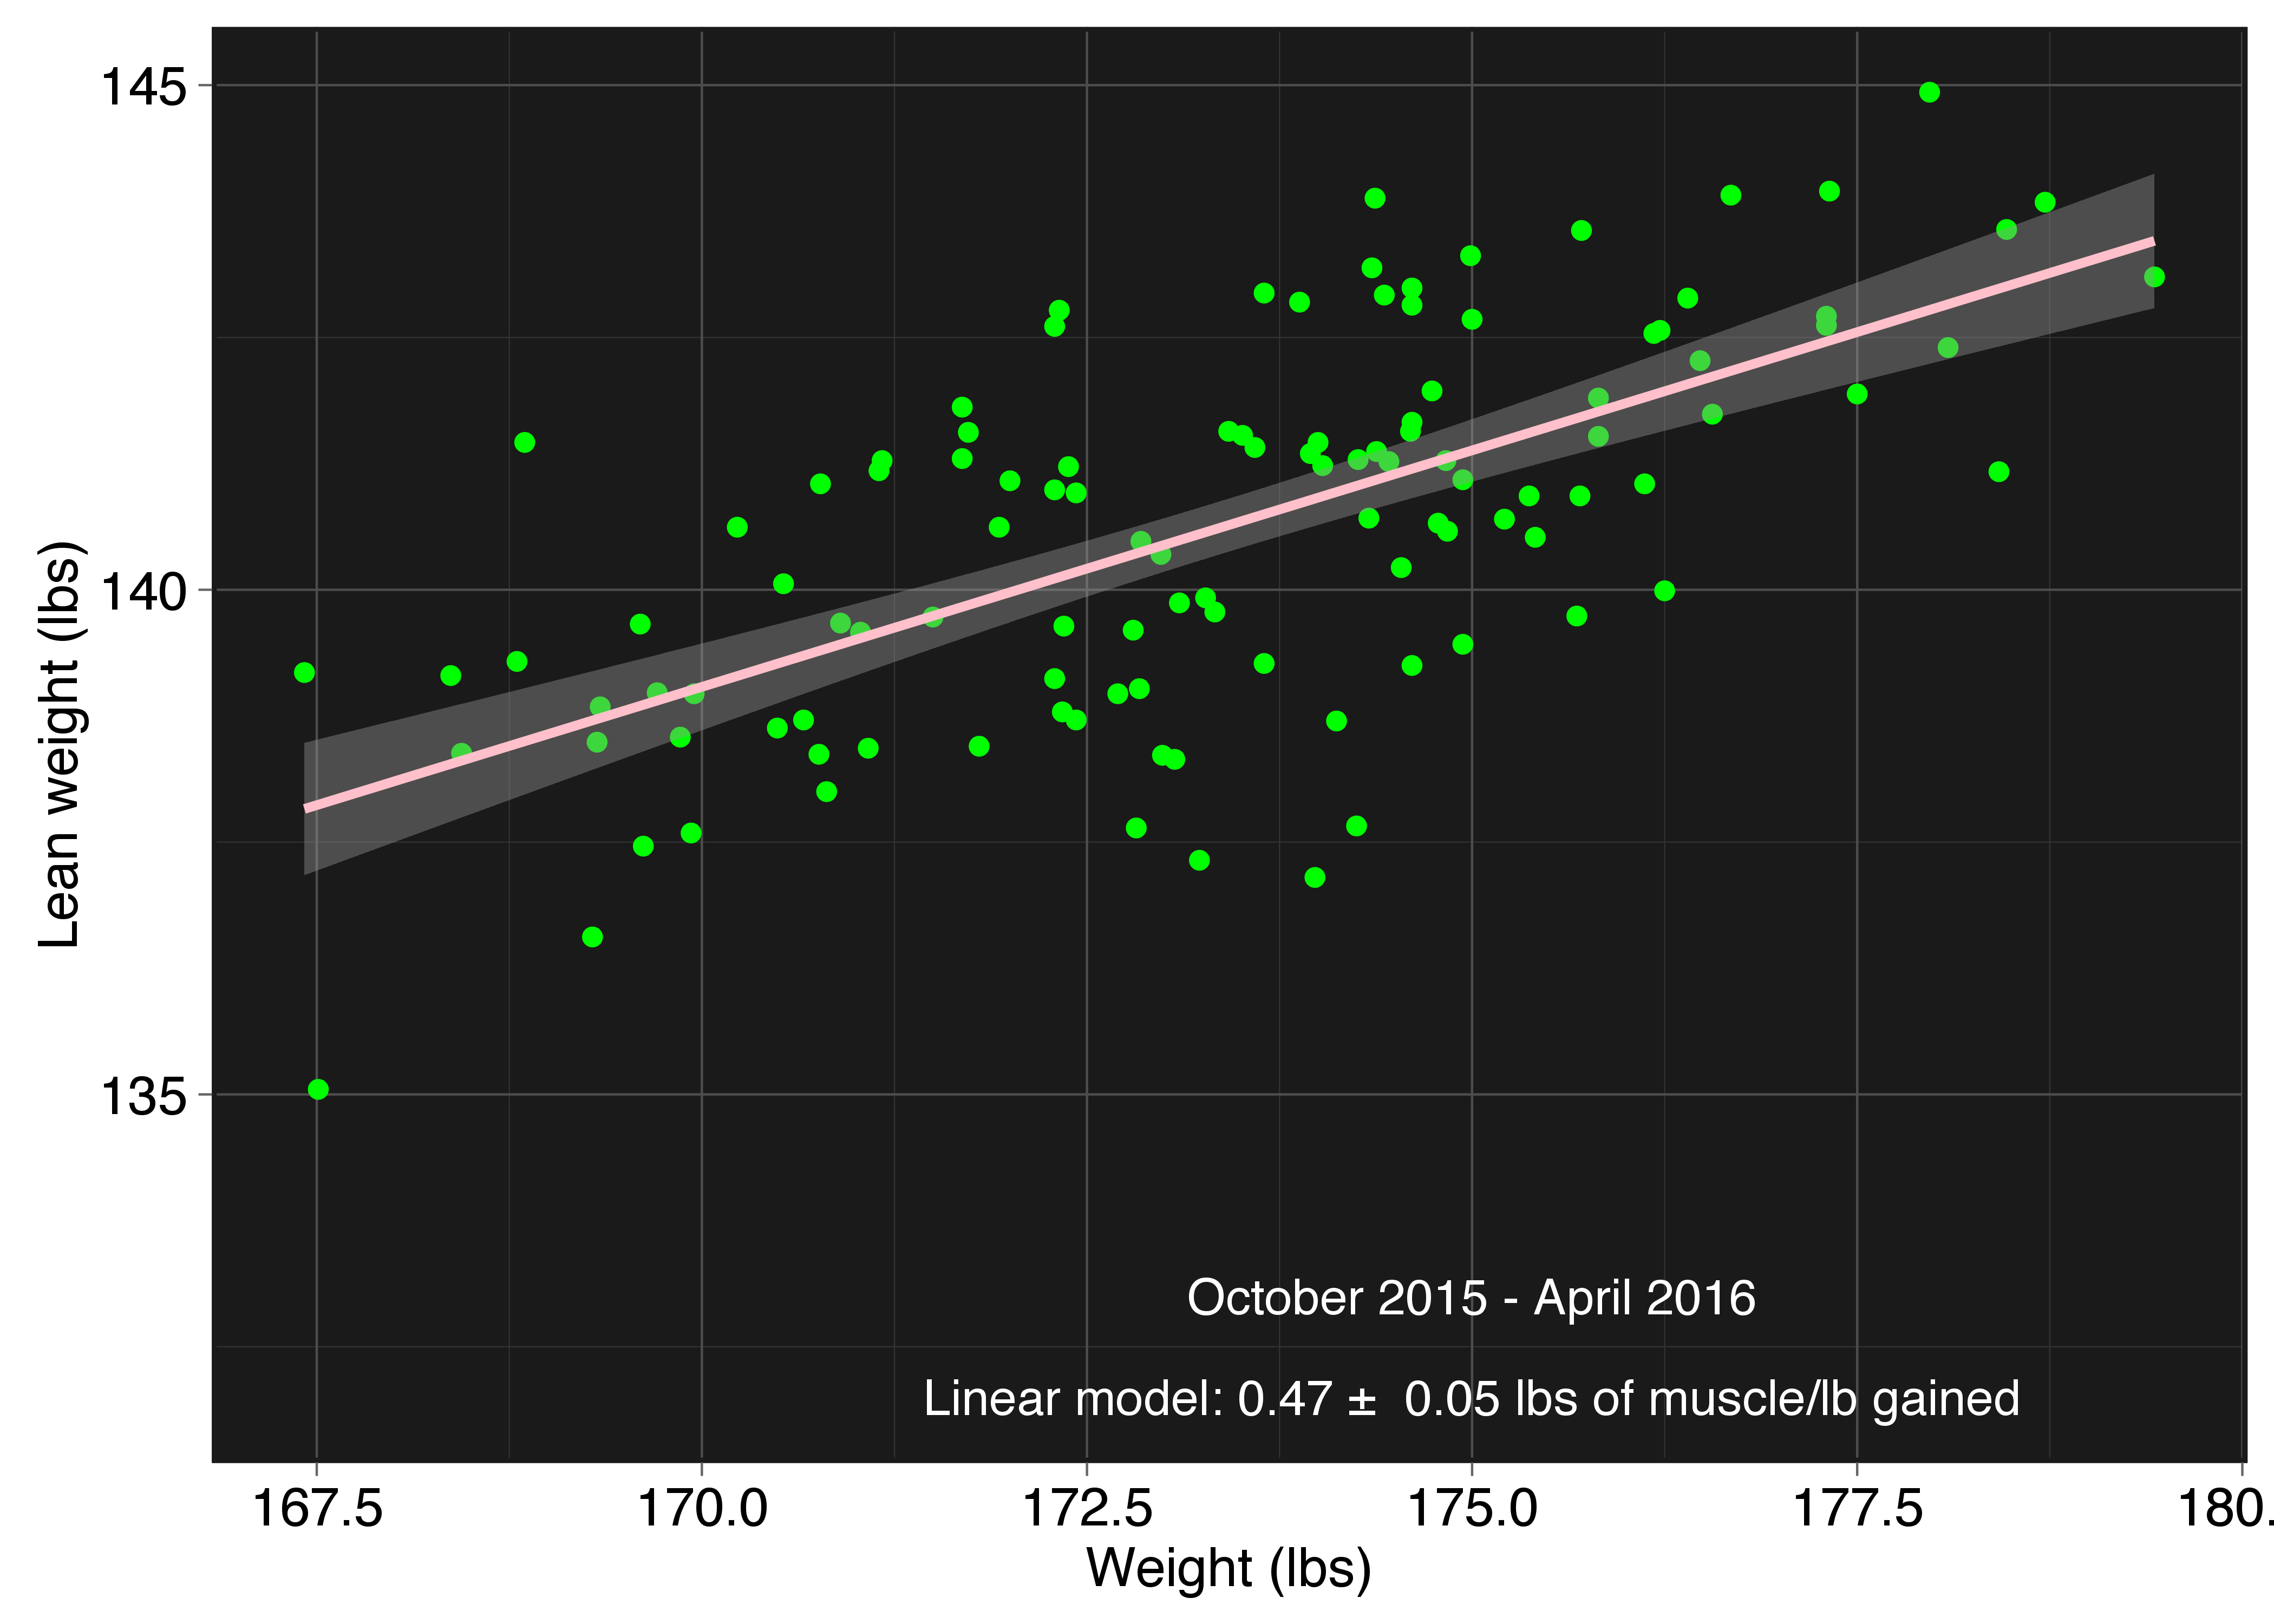
Okay, so the gaining period is not much different: 0.47/(1-0.47) = 0.89 lbs muscle per 1 lb fat. Slightly lower muscle/fat gain ratio, but anything close to 50/50 I consider pretty decent. Re-analyzing the cutting period data with only night time measurements:
Thank god! Now analyzing the data with full knowledge of the performance of the scale, I can see that it’s actually the opposite situation: I’m losing 3.3 lbs of fat for every 1 lb of muscle, which is a much better result.
I can now use all of this information and try to project out into the future what my body composition would be like after several cycles of bulking and cutting, assuming 180 days per period and the same rates and proportions of weight loss and muscle gain as above. These assumptions are certainly not entirely true, but they’re based on the best knowledge I have and thus gives a useful model for planning purposes.
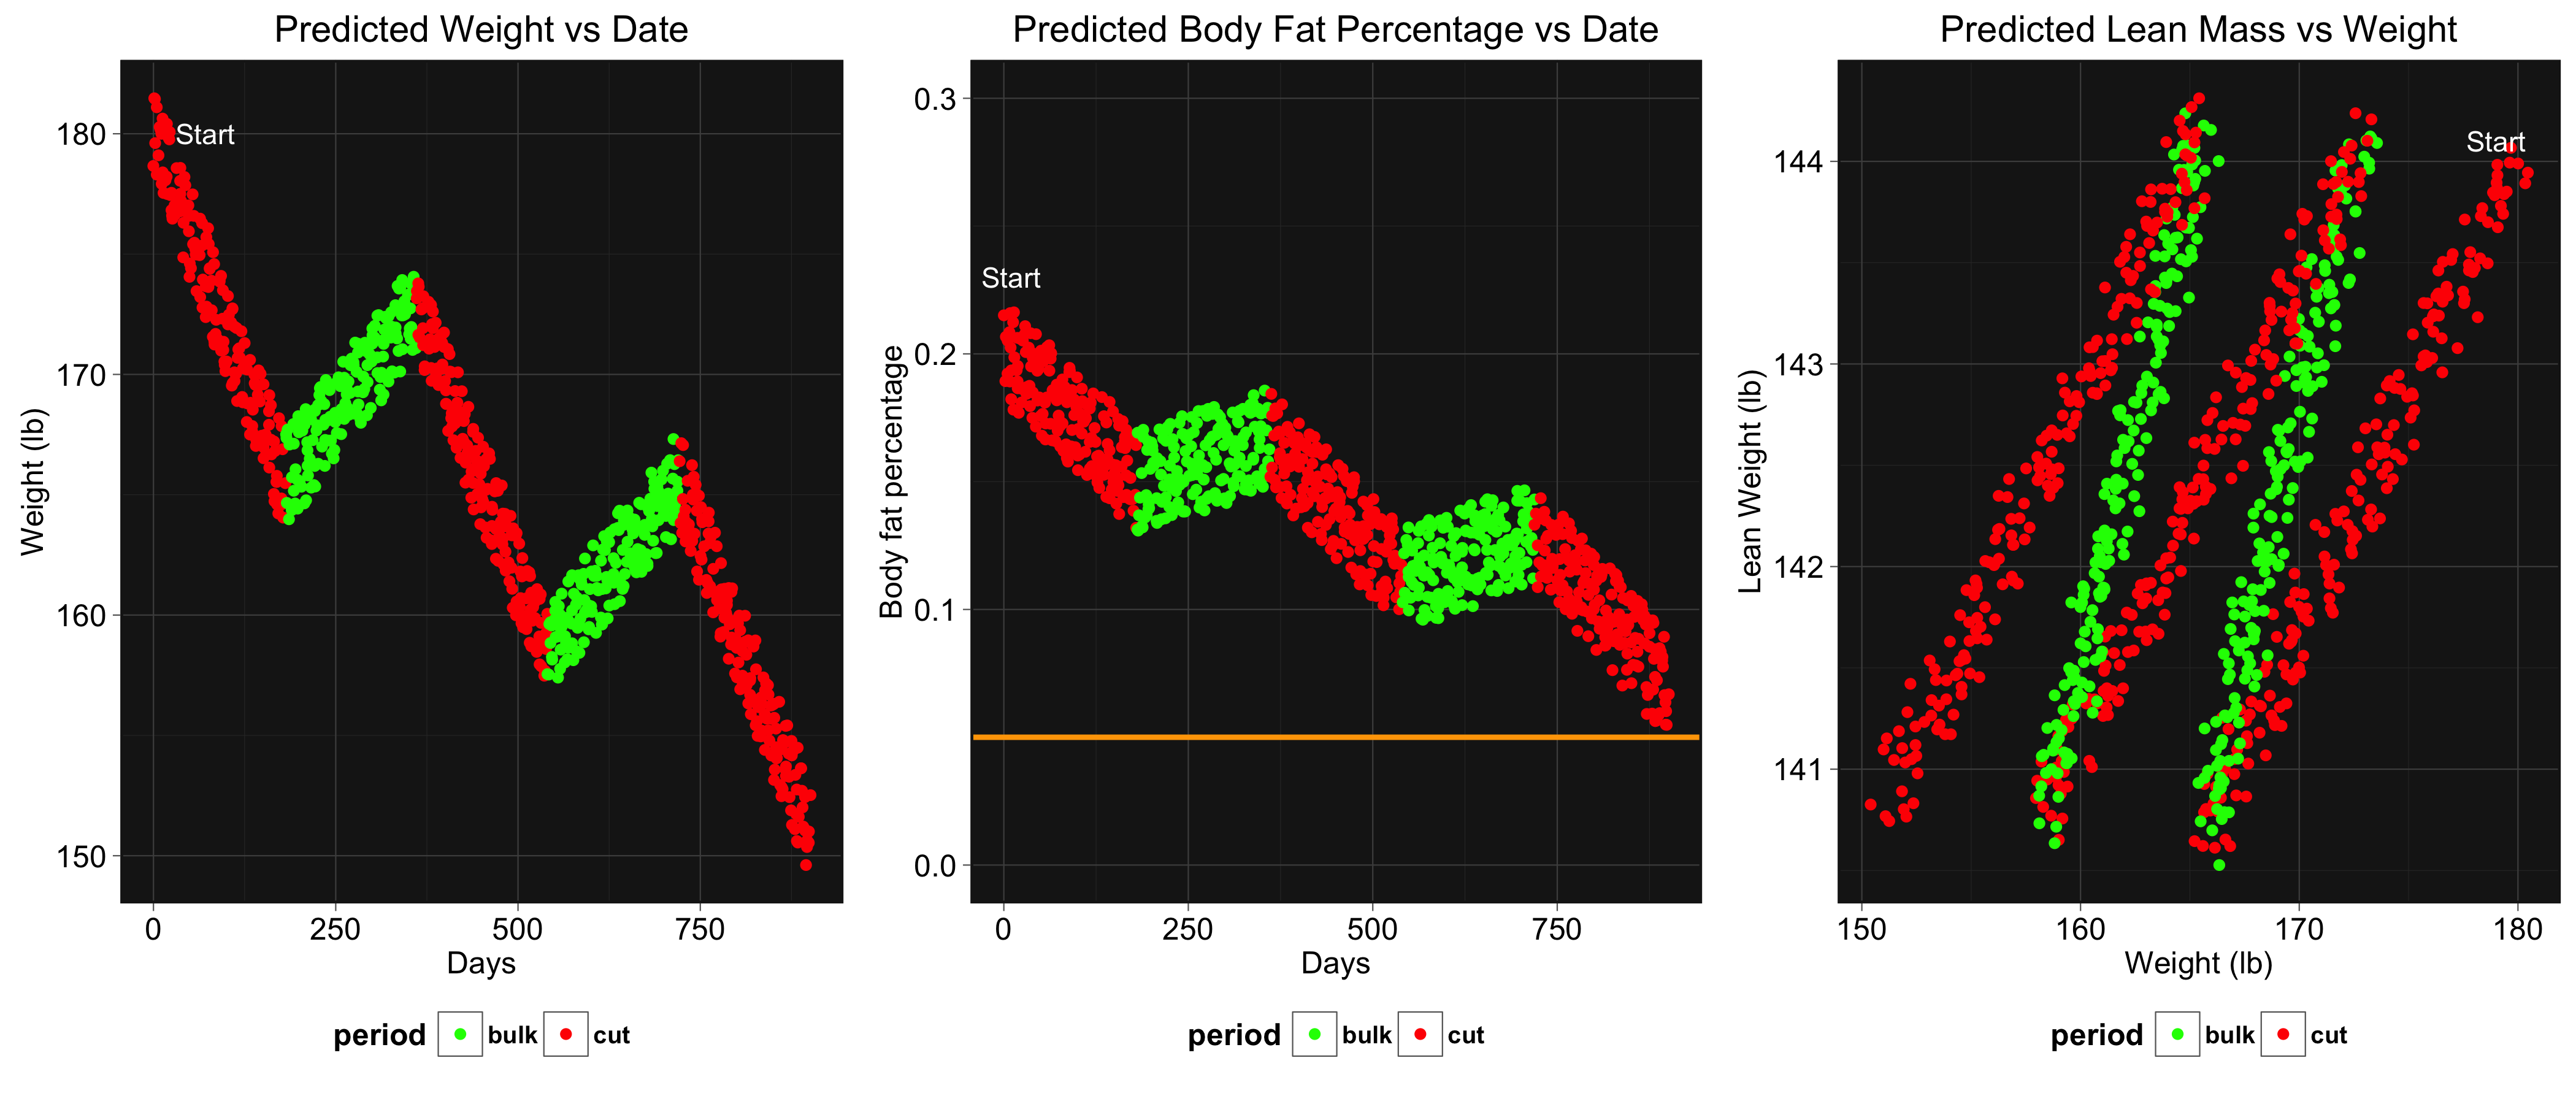
This prediction is saying if I continue with this bulk and cut cycle as is I won’t add any large amount of muscle to my frame (as seen by the chart on the far right). However, I will get significantly more well defined as my body fat percentage drops and I will maintain the muscle I current have. This projection is simplistic in that the rates certainly will change as my body composition changes (you can’t lose weight or gain weight forever!), but it gives me a much better idea of the potential time frame of my goals as well as a framework to build my routine on in the future. If I choose to focus on strength and lean muscle gain instead of body composition, I see one thing I could try is to shorten the length of my cuts and lengthen my bulks and thus end up with a substantial net gain of muscle per cycle. Any particular number in the prediction is not important; The real utility comes from projecting out the general trends I was able to extract from the real data–straight from my own body– as a useful planning tool for structuring my own long term goals.
CONCLUSION
In summary: A scale can be an incredible useful tool for tracking all of your weight and body composition goals, as long as you understand how to use it. Measuring yourself at a consistent time, well after any long rest period, and when fully hydrated gives you the most consistent and accurate results. The utility of the data a scale provides grows as you collect it, and thus the more data you have, the more you can tailor your fitness routine to your overall goals.
REFERENCES
- Kitahara CM, et al. Association between Class III Obesity (BMI of 40–59 kg/m) and Mortality: A Pooled Analysis of 20 Prospective Studies. PLOS Medicine. July 8, 2014. DOI: 10.1371/journal.pmed.1001673.
- Sturm, Roland. “The effects of obesity, smoking, and drinking on medical problems and costs.” Health affairs 21.2 (2002): 245-253.
- Pacanowski, Carly R., Fredrik Bertz, and David A. Levitsky. “Daily Self-Weighing to Control Body Weight in Adults.” SAGE open 4.4 (2014): 2158244014556992.
- Levine, Emma E., and Maurice E. Schweitzer. “The affective and interpersonal consequences of obesity.” Organizational Behavior and Human Decision Processes 127 (2015): 66-84.
- Evans, W. D., H. McClagish, and C. Trudgett. “Factors affecting the in vivo precision of bioelectrical impedance analysis.” Applied radiation and isotopes 49.5 (1998): 485-487.
- Kushner, Robert F., Rani Gudivaka, and Dale A. Schoeller. “Clinical characteristics influencing bioelectrical impedance analysis measurements.” The American journal of clinical nutrition 64.3 (1996): 423S-427S.
- Dehghan, Mahshid, and Anwar T. Merchant. “Is bioelectrical impedance accurate for use in large epidemiological studies?.” Nutrition Journal 7.1 (2008):
- Lukaski, Henry C., et al. “Validation of tetrapolar bioelectrical impedance method to assess human body composition.” Journal of Applied Physiology 60.4 (1986): 1327-1332.
- Wagner, Dale R., and Vivian H. Heyward. “Measures of body composition in blacks and whites: a comparative review.” The American journal of clinical nutrition 71.6 (2000): 1392-1402.
- Malina, R. M., Y. C. Huang, and K. H. Brown. “Subcutaneous adipose tissue distribution in adolescent girls of four ethnic groups.” International journal of obesity and related metabolic disorders: journal of the International Association for the Study of Obesity 19.11 (1995): 793-797.