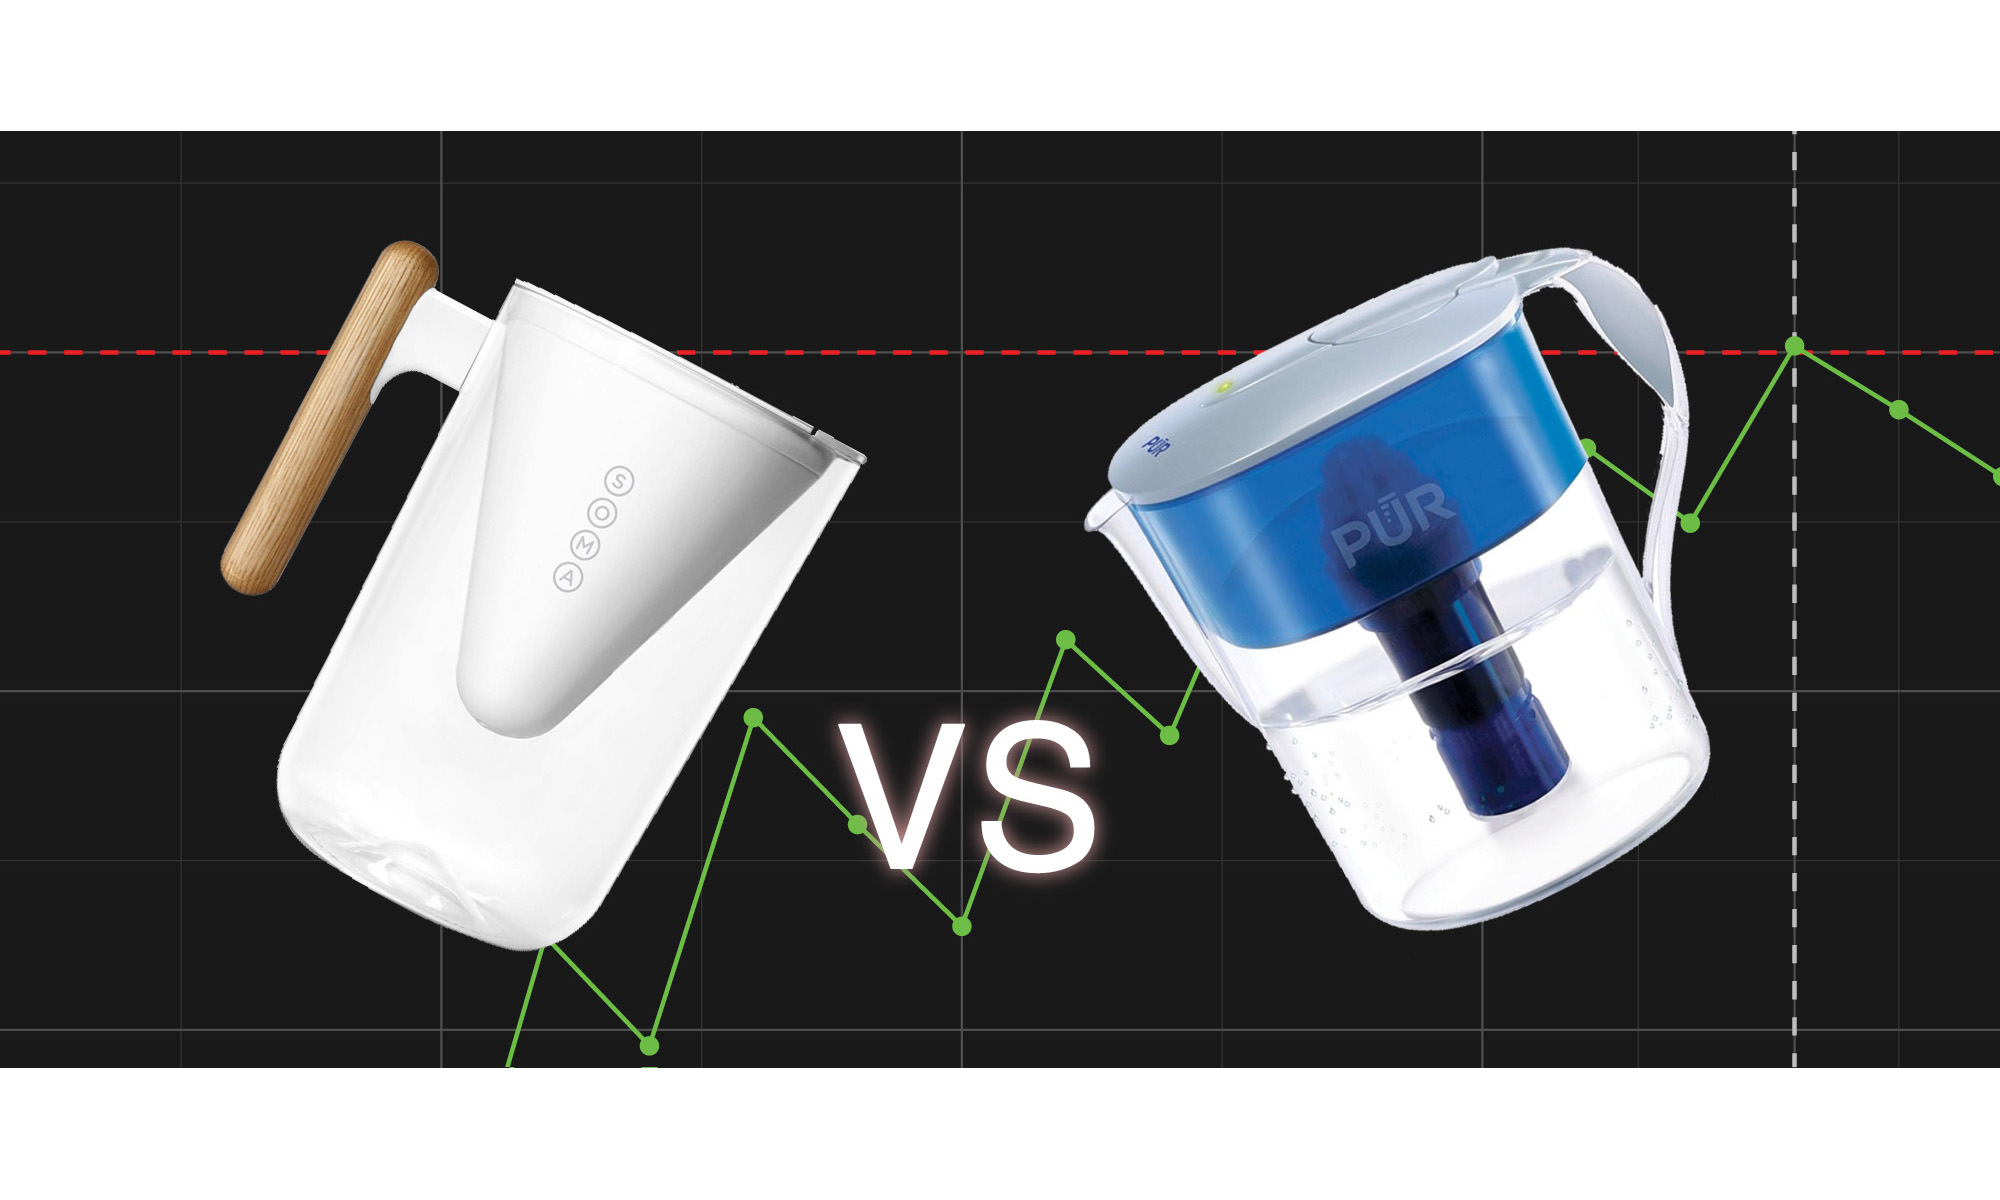
Soma Water Filters Are Worthless: How I Used R To Win An Argument With My Wife
“Can you really tell the difference?” - My wife, expressing fighting words
This experiment was inspired by a light-hearted argument with my wife, a stylish but atrocious water filter, and the explosion of start-ups attempting to turn everything you purchase into a subscription service.
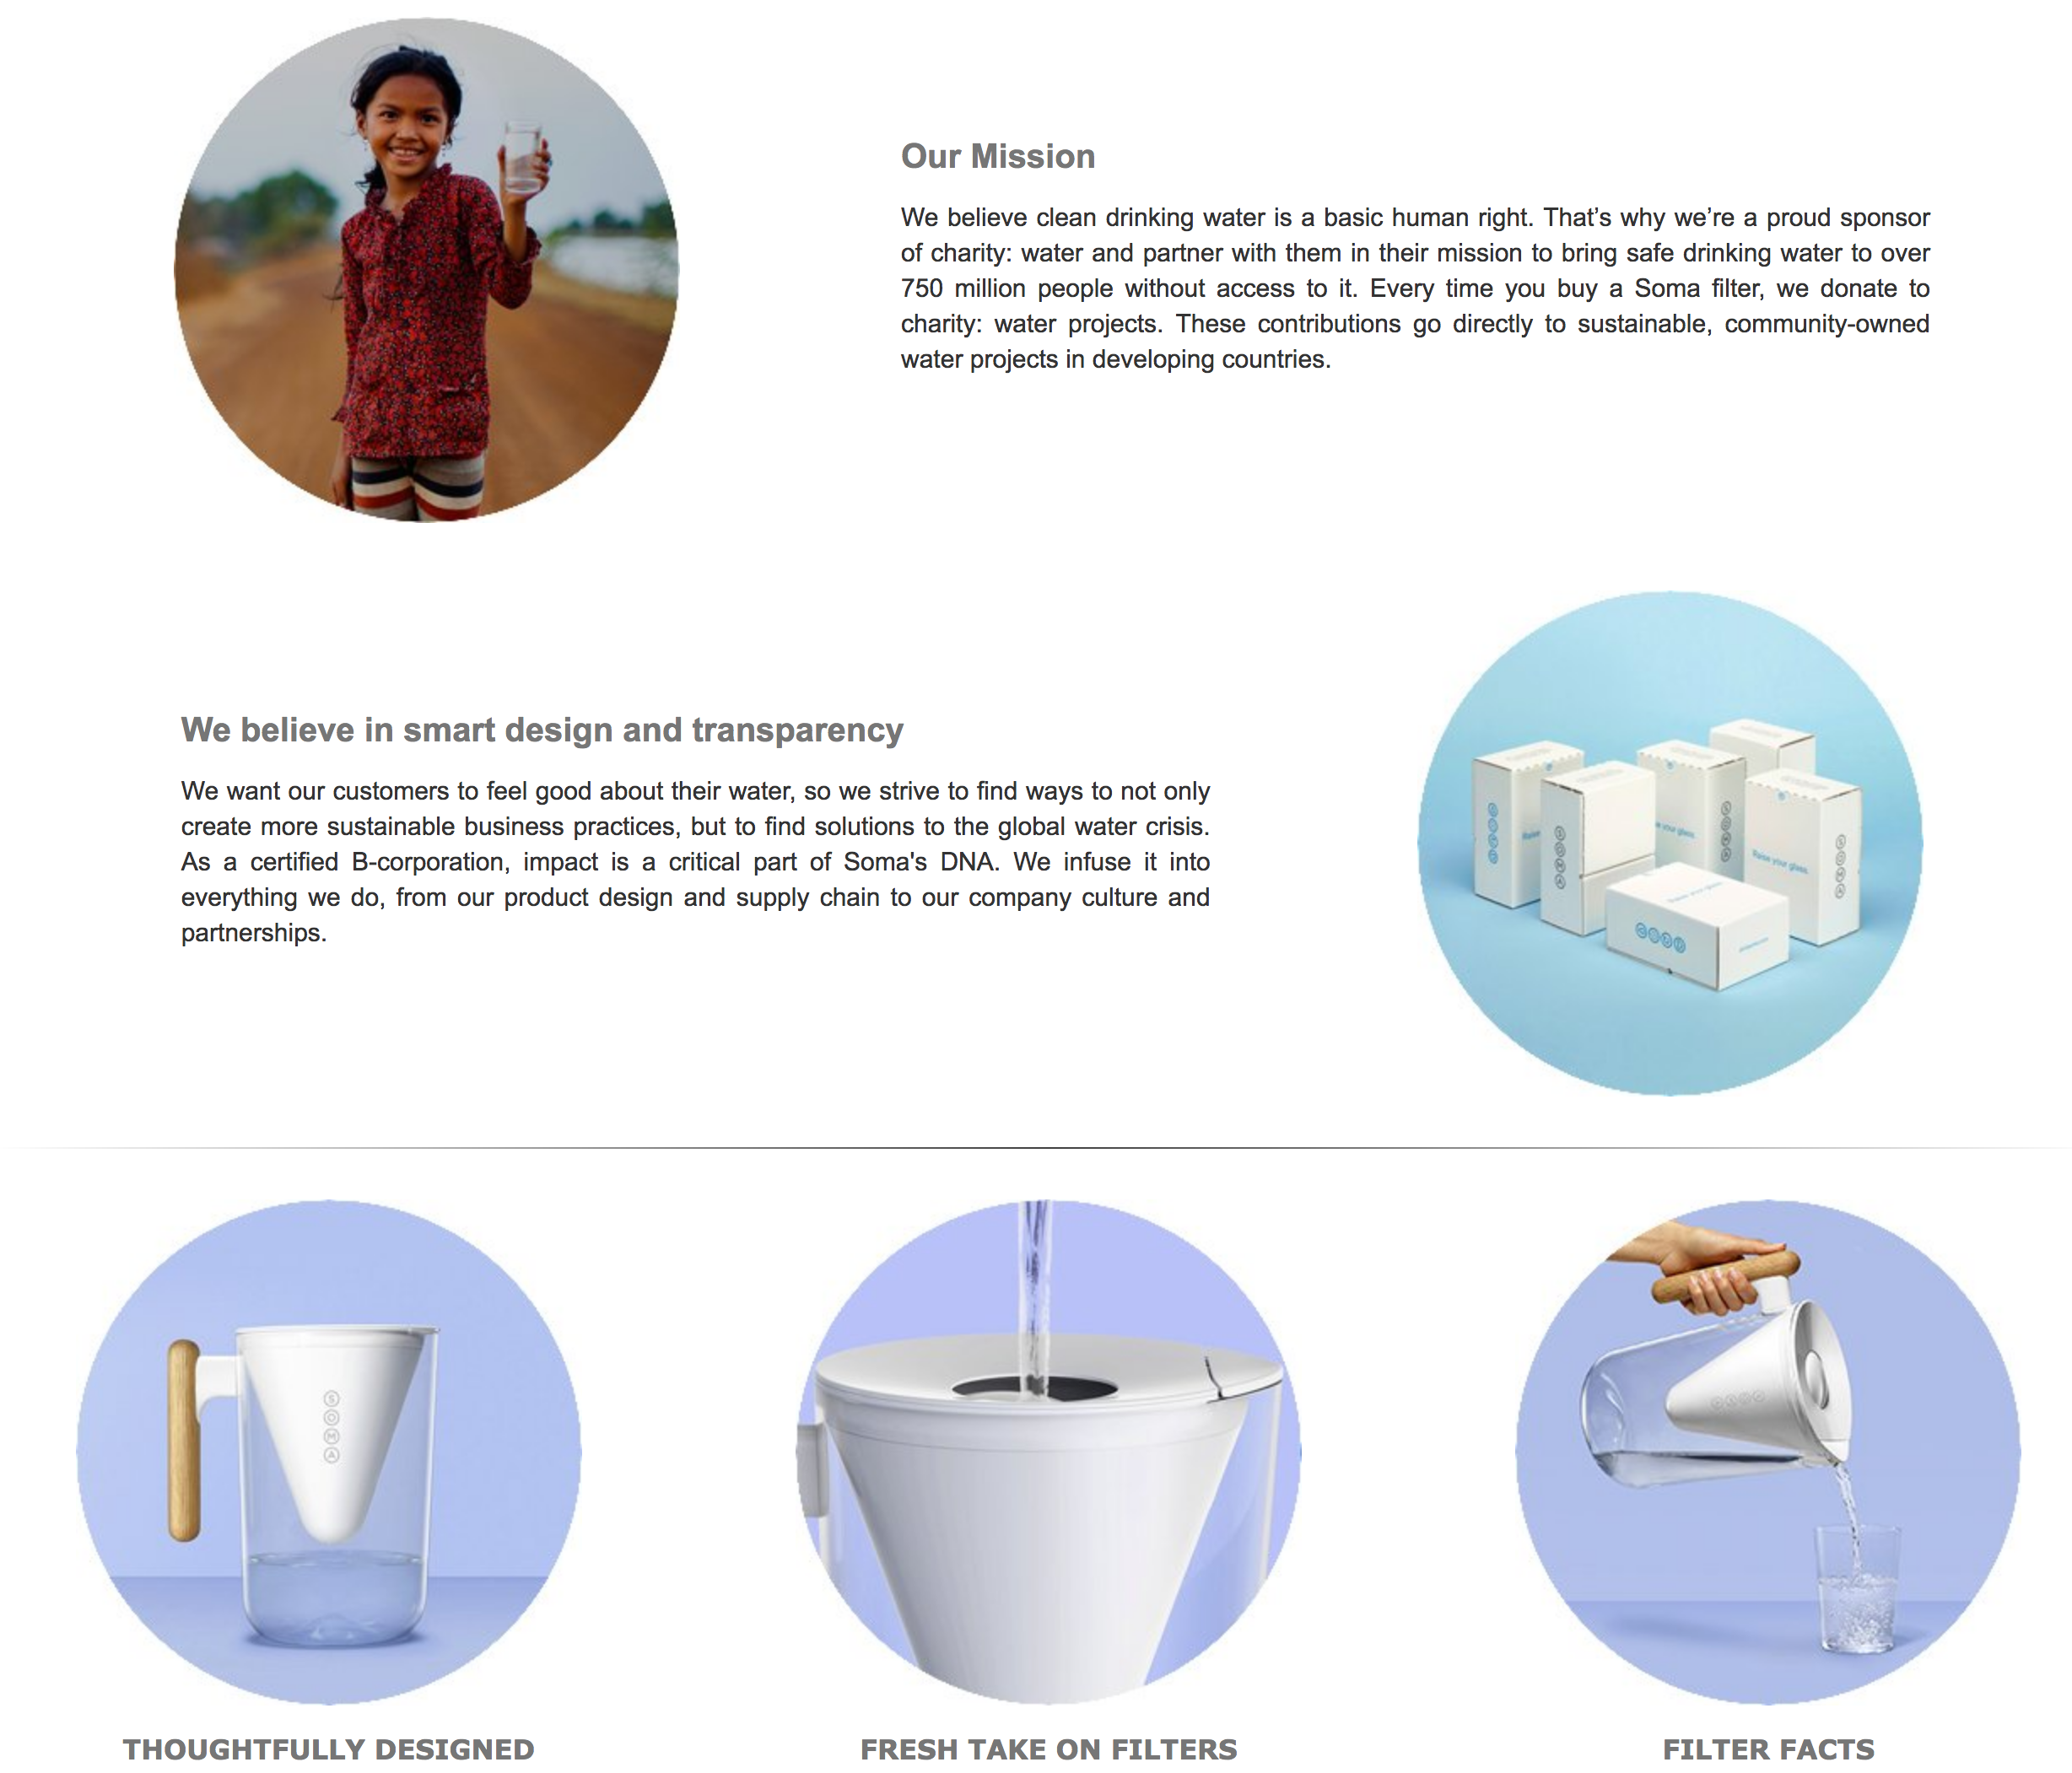
About a year ago I was growing tired of our tap water and its overly chlorinated taste. Initially I thought just to buy a Brita, but Brita filters always seemed like something you’d shove in your dorm room mini-fridge and not display on your kitchen counter. I looked around to see if there was anything better out there, and lo and behold, there was a water filter company called Soma with a beautifully designed water filter that seemed to fit the bill. They emphasize how their filters are “plant-based” and “sustainable”, but I just cared about the design. They also put their CEO’s head in a circle (along with all their other pictures), which is the universal “Hey Millennials! Our Corporation is Different” indicator, so as a millennial I believed that they believed in their mission statement and just wanted to deliver me an effective and stylish water jug. The initial reviews on Amazon seemed fine, so I went to their website and placed an order.
The filter arrived a few days later and it indeed looked great. I followed all the instructions for prepping the water filter, and then turned on the tap to fill it up. Immediately I was struck by how quickly the filter seemed to be “filtering” the water. My experience with other filters was filling the upper chamber and coming back in five minutes after it slowly dripped through, but the water in this filter seemed to be traveling relatively unimpeded from the upper chamber to the lower. Impressed by the speed at which Soma was able to filter their water, I waited for the flow to stop and poured myself a glass.
It did nothing.
“Can you really tell the difference? I think you’re crazy. They all taste fine to me.”
A statement which I couldn’t refute, as the filter I did have was used and I certainly wasn’t going to order a new one.
A few months later, I got a package in the mail from Soma. It turns out if you order from their site, you agree to sign up to their filter subscription service, where they “helpfully” send and charge you for a new filter every few months. This is part of a larger trend in startups subtly signing you up for subscription services by purchasing their products, a practice pioneered in the 90s by “8 CDs For A Penny!” Columbia House and now adopted online for everything from lingerie to kids clothing to women’s active wear (who is trying to make subscription clothing a thing? Stop trying to make subscription clothing a thing).
Anyway, armed with a fresh Soma filter (one which they touted was improved from their previous filter), I cancelled my subscription and set out to design an experiment to test my ability to distinguish between water types. And hopefully show both how I could tell the difference between filtered and unfiltered water, and potentially show empirically how bad the Soma filtered water tasted.
How do you design an unbiased experiment when you’re predisposed to a certain outcome?
I went online, did some research to see what other people had done, and found this post where someone actually tested the chlorine and impurity content of various filters. The important takeaway from that post is that while other similar filters reduced chlorine content by 95%, the Soma filter only reduced it by about half. Their testing methodology was good, but they based their overall decisions on a subjective ranking system that doesn’t emphasize how poorly the Soma filtered water tasted. The Soma filter did indeed filter less chlorine out of the water, but was there a more objective way to show how terrible it tasted? In addition, how do you design an unbiased experiment when you’re predisposed to a certain outcome (in this case, the Soma filter does not change the taste of tap water).
I decided to perform a series of blind pairwise comparisons between four types of water: Pur filtered, Soma filtered, tap, and bottled water. The goal was to see how distinguishable each type of water was from each other type. I wouldn’t know what types of water being compared in each round, and the drive to prove my wife that I could indeed distinguish filtered water from tap (and thus scientifically and indisputably win a marital argument, a rare event) would keep me honest. If I showed I could distinguish between types of water, but couldn’t tell the difference between tap and the Soma water, then I objectively showed that the Soma filter did little to change the taste of the water.
For types of water that were indistinguishable, I would only be able to correctly classify them about 50% of the time, by chance. For types of water that were distinguishable, I should be able to correctly categorize a significantly higher percentage of them. Here, I define that percentage as 75%. Along with assuming an acceptable false negative rate (\(\beta\)) of 0.20 and a false positive rate (\(\alpha\)) of 0.05, this sets my minimum required sample size at 23 runs. You can see this in the following figure, where the power (which is 1-\(\beta\)) crosses the 0.80 threshold at 23 runs. There is no formal industry (where “industry” here is a term that loosely means “researchers”) standard for power, usually 80% is a cutoff for an acceptable design size [1]. For an (\(\alpha\)) of 0.05, this means we accept four times as many false negatives as false positives, with the idea that a false negative is usually not as bad as a false positive result.
Usually, power is a monotonically increasing function of sample size, but for a binomial test you get the odd case where a slightly lower number of runs will occasionally have higher power than a design one or two runs larger. This is due to the discrete nature of the binomial distribution.
experimentsize=1:25

alpha=0.05
baseprob = 0.5
thresholdprob = 0.75

power = 1-pbinom(qbinom(1-alpha,experimentsize,baseprob),experimentsize,thresholdprob)

poweranalysis = data.frame(experimentsize,power)(An easy way to calculate sample size if you don’t want to do it by hand is the tool G*Power, which is free and available on most platforms)
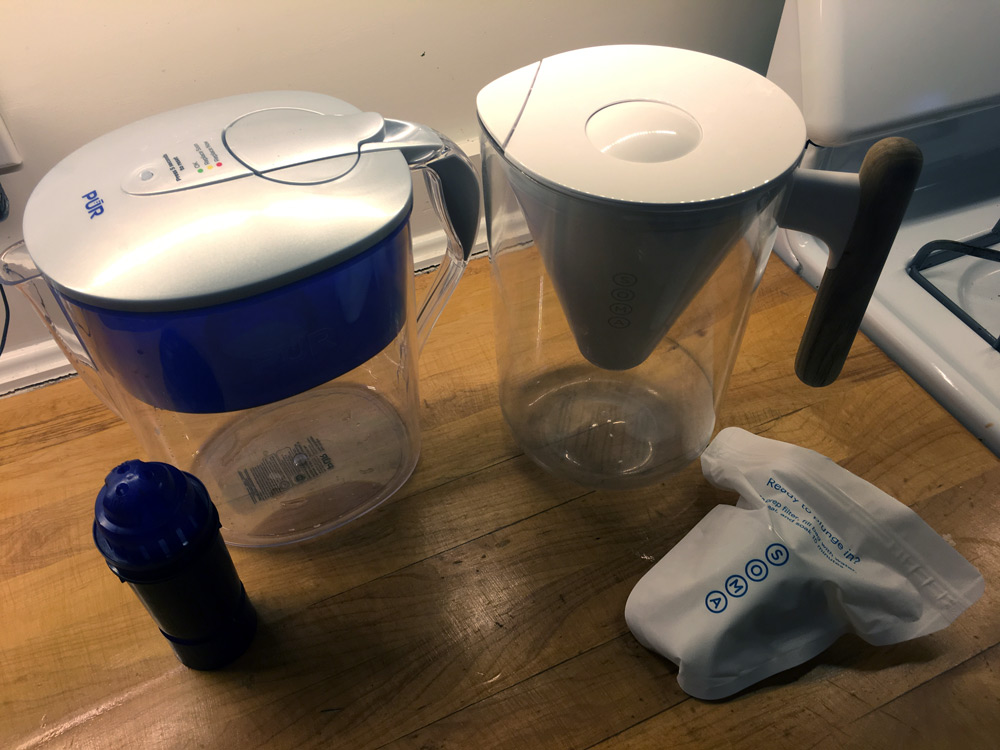
Each round now involves filling up 48 cups of water, 23 with water type A and 23 with water type B, along with a taste calibration cup for each type before starting each round. The cups are lined up side-by-side for 23 rounds, and then a random number generator tells my wife how to switch them. Correctly determining when the cups were switched here indicates I successfully distinguished them. Here’s an image of the set-up:
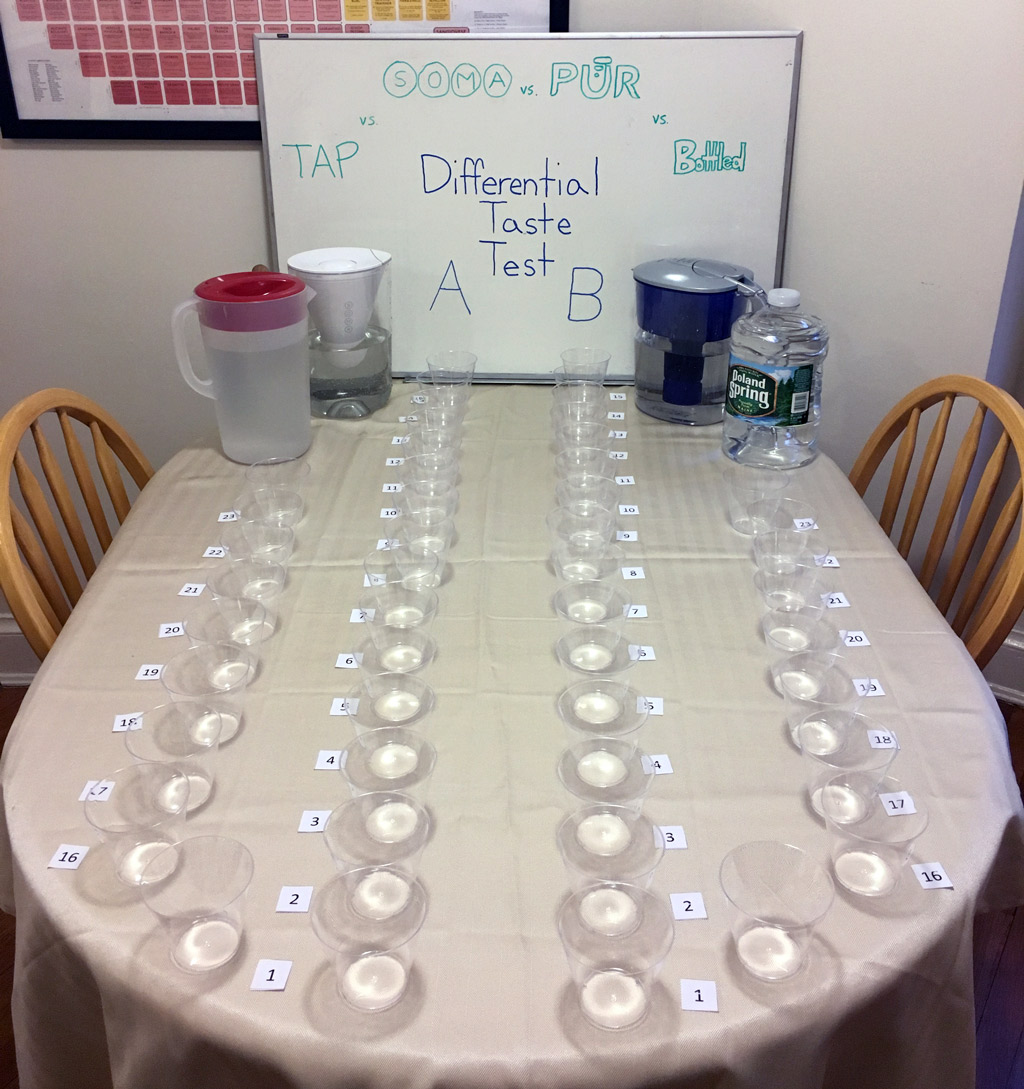
Here, I controlled for several variables. First, I filled all the pitchers the previous night and let the temperature settle to 73 degrees, and confirmed they were all the same with a laser thermometer before the start of the experiment. I had my wife run randomize (with a random number generator) both the cup switches as well as the order the water types were compared. Between each round, I left the room while she filled and arranged the water, and had her hide the pitchers during each round. I dried the cups after each round to remove any traces of the previous water. I also did a control round, where all 48 cups were filled with the same type of water and I was tasked with the (futile) goal of trying to classify them. This would make it less clear to me (as the subject) if two waters tasted the same which two waters I was drinking. Finally, and most importantly, my wife agreed to participate (she’s a good sport).
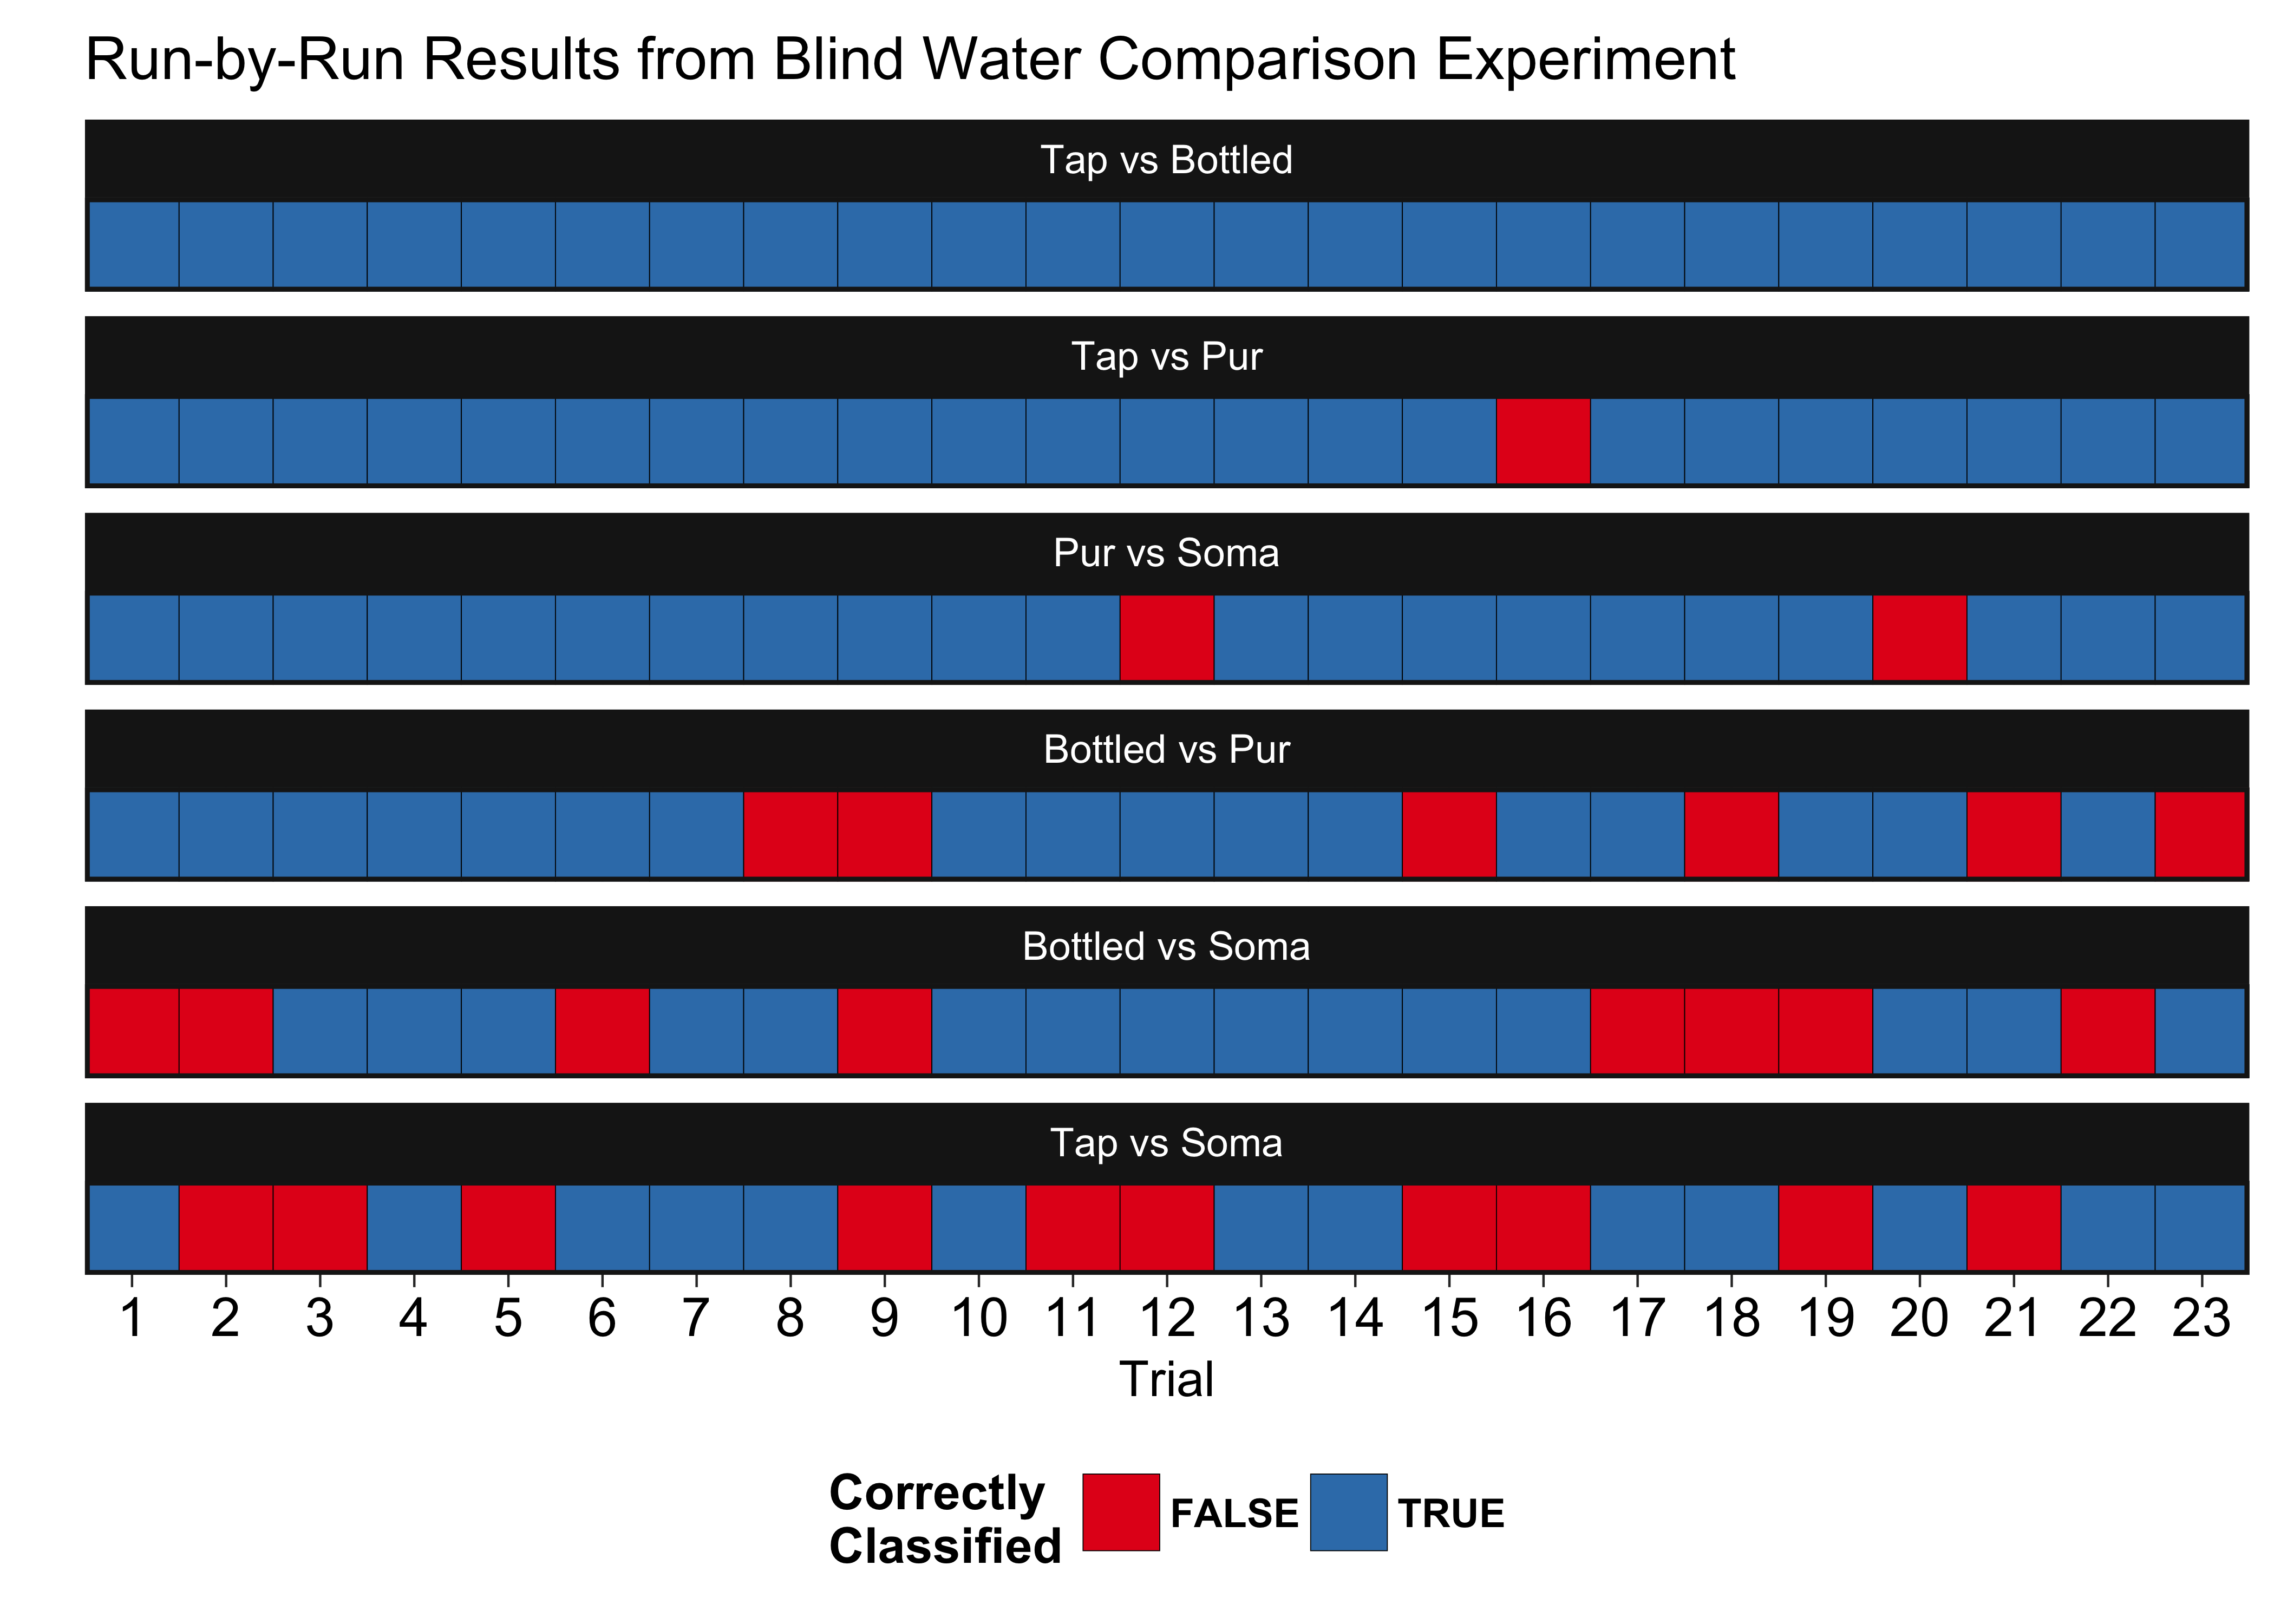
And here are the actual results of the experiment, shown in decreasing order of distinguishability:
We take this data, and then determine the number of successes and see if the number is statistically different than 50%. We calculate the p-values directly, but we can also show this visually in the lower confidence intervals. If the lower confidence interval crossed 50%, the value is not significantly different and we cannot say the water types are significantly different. The upper confidence intervals are not shown because it is a one-sided test (they just stretch to 1).
results = experiment %>%
  group_by(Comparison) %>%
  filter(Truth == Data) %>%
  summarize(successes = n(),
            pval = binom.test(n(),23,p=0.5,alternative = "greater")$p.value,
            lowerci = binom.test(n(),23,p=0.5,alternative = "greater")[[4]][1],
            upperci = binom.test(n(),23,p=0.5,alternative = "greater")[[4]][2])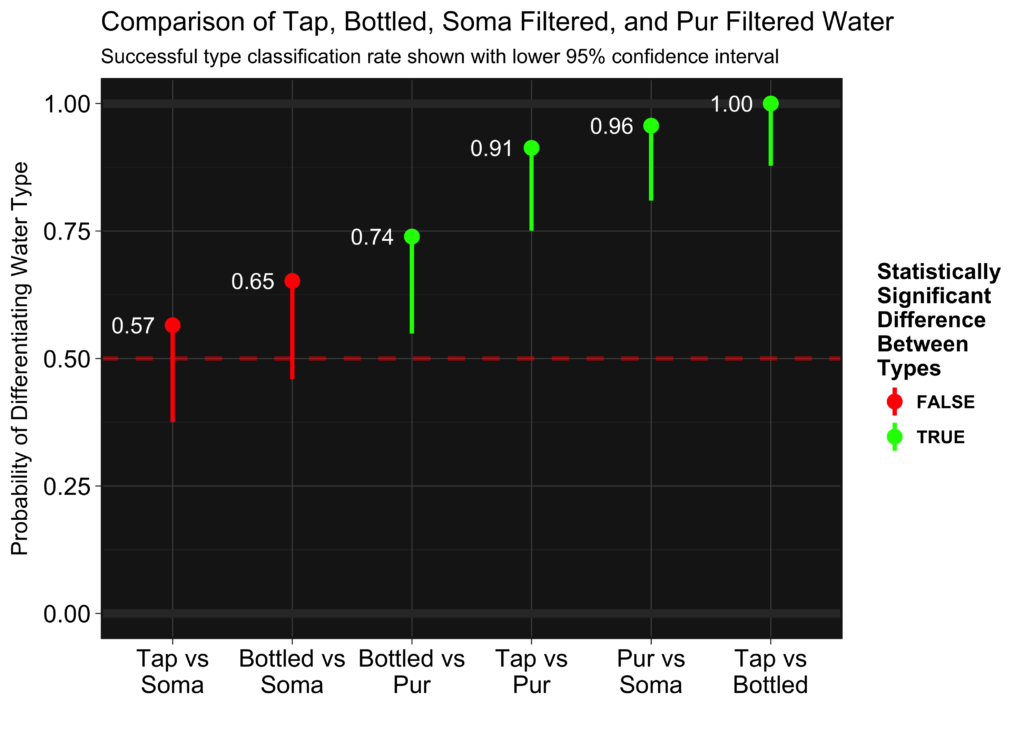
Soma filtered water performed the worst, having a taste statistically indistinguishable from tap water. Bottled water performed the best, being distinguishable from tap 100% of the time. Pur did almost as well against tap, only having two misclassifications. It did even better against Soma filtered water, with only one misclassification. Bottled and Pur filtered water were harder to distinguish, but here it shows there is a difference. In this case, I described the Pur filtered water during the test as “smooth” and the bottled water as “slightly alkaline,” and I actually preferred the Pur water’s taste to the bottled. Here, bottled vs Soma filtered are also statistically not different, but only one more success would have made them. If you look at the actual data above, you can see the first two runs accounted for 2/8 of the errors made in that round. The first couple runs are coming right off the initial calibration cups, so its possible that I was not fully “calibrated” to the taste. In addition, I designed the test with an acceptable false negative rate of 20%. If we assume everything but the Tap vs Soma is distinguishable, one out of five false negatives is within the designed sensitivity of the experiment.
Soma filtered water performed the worst, having a taste statistically indistinguishable from tap water.
Here we look at the actual p-values of all the comparisons:
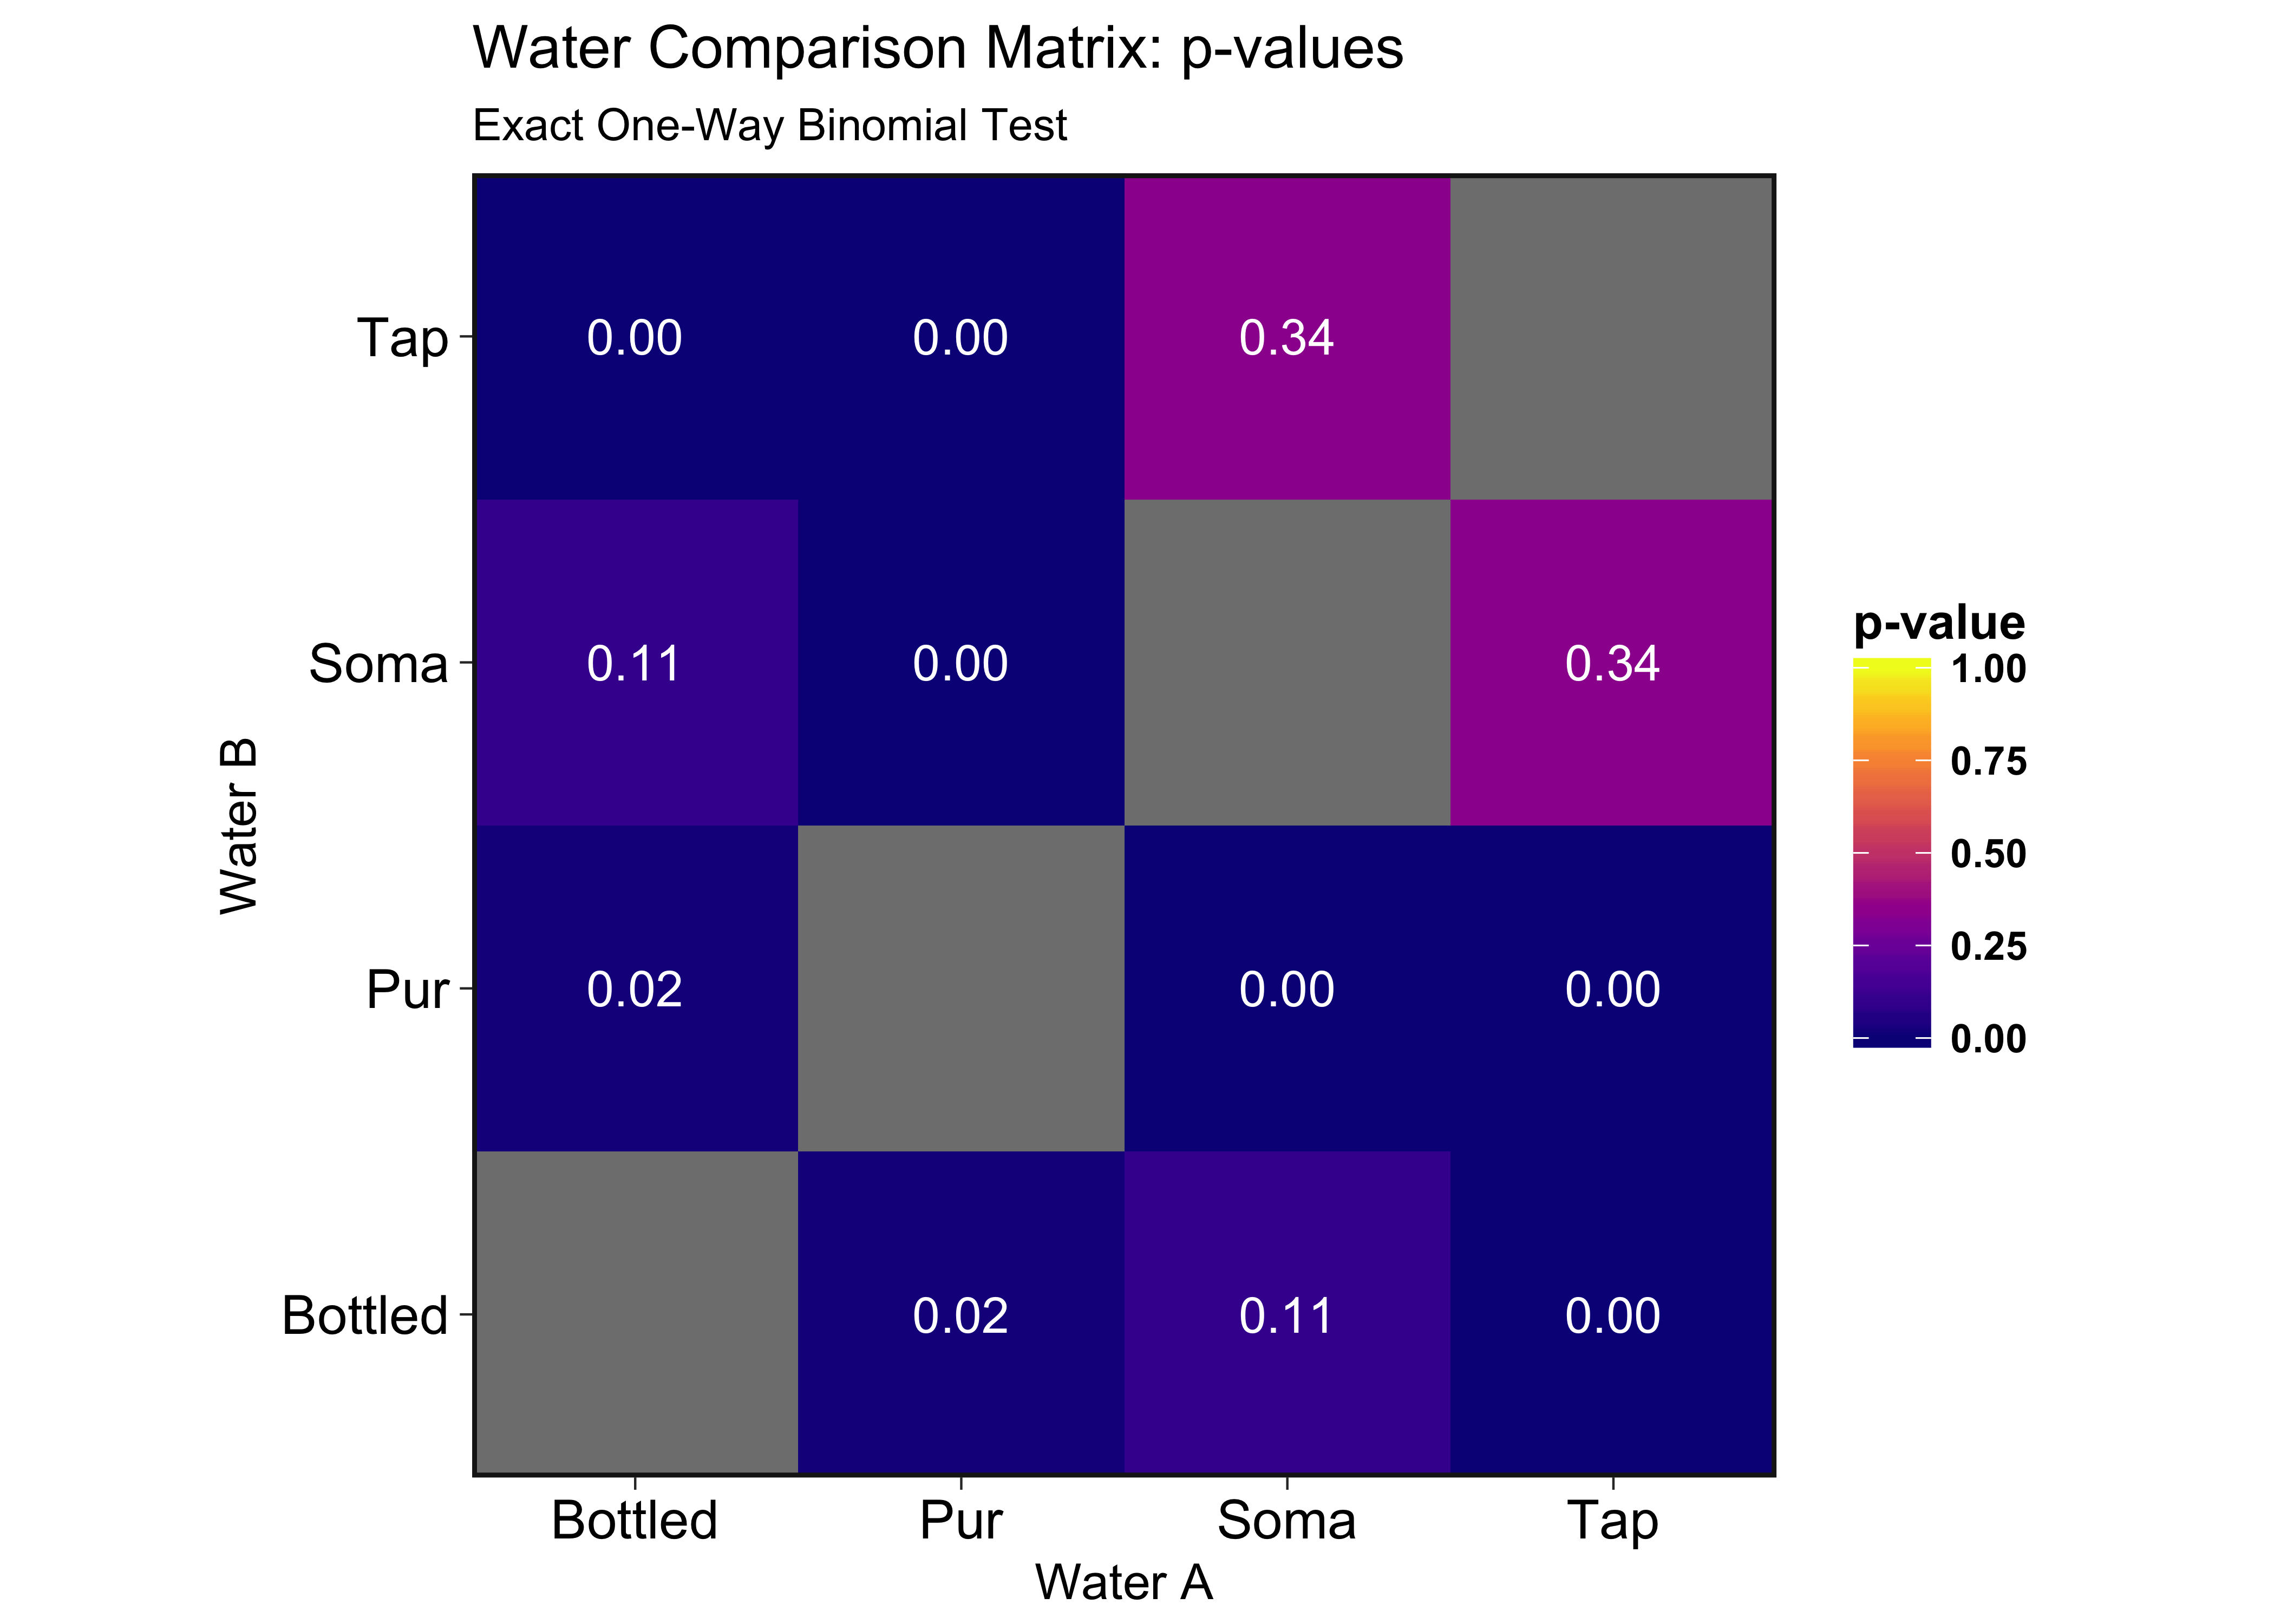
Looking at the tap water row, it’s obvious here that the Soma filter does little to nothing in improving the taste from ordinary tap water. Their marketing campaign spouts how environmentally friendly their product is, but I doubt the environmental worth of a worthless (but pretty) piece of plastic.
In terms of arbitrary ranking scales: I rate it 0/5 empty water cups. Thanks, Soma.
As for recommendations, the Pur water filter is cheap and the filters themselves don’t cost a lot. It’s still just looks like a water filter and won’t win any style rewards, but it actually does the one job that it’s supposed to do. As for me and my wife’s argument, she no longer thinks I’m crazy for thinking the Soma water tastes bad–now I’m crazy because I spent three hours on a Sunday night sipping glasses of water. ¯\(ツ)/¯